Systemic risks break through multiple support levels, BTC and HYPE temporarily in cash and on the sidelines | Guest Analysis


- Core View: BTC broke below the 52-week moving average with a high-volume long bearish candle, declaring the bull-bear transition failed and the market returning to a bear market. In the short term, the key focus is whether the 57,820–60,000 USD area can stabilize and halt the decline; HYPE barely held the long-term uptrend line in late trading, leaving the bulls a glimmer of hope, but the trend is confirmed to have weakened.
- Key Elements:
- BTC's weekly candle fell 13.98%, closing at about 74,900 USD, effectively breaking below the 52-week moving average (about 76,100 USD), after having traded above that line for eight consecutive weeks.
- The weekly chart shows a five-segment correction structure from (0-1) to (4-5), with the descending central zone's upper bound at about 82,850 USD and lower bound at about 60,000 USD; it is currently in a potential departure segment (4-5).
- The daily chart's high-volume long bearish candle broke through three layers of support: the 72,000 USD trendline, the 72,610 USD 0.5 Fibonacci level, and the Shijie ribbon at 72,510–73,120 USD.
- The proprietary "Daily Turning Point Monitoring System" has a historical success rate of about 70% across three turning points, and this cycle has issued its fourth yellow bottom signal, with the depth index at -18 to -18.8.
- BTC's core support levels are, in order, 60,000–62,000, 57,820, and 54,500 USD; resistance zones are 67,300–69,000, 72,500–73,000, and 75,500–76,000 USD.
- HYPE fell 8.61% for the week with a 27.92% amplitude, hitting a low of 60 USD and closing at 68.11 USD, landing precisely on the long-term uptrend line.
- Trading strategy: For both BTC and HYPE, the short-to-medium term strategy is to stay in cash and wait for direction to become clear.
After the close on November 1, BTC's weekly candle settled at around $74,900, landing right near the 52-week moving average (around $76,100). At that point, the price had been trading above the 52-week MA for eight consecutive weeks, marking its first pullback to this bull-bear dividing line. In the previous weekly review, we used our proprietary [52-Week MA Confirmation Method] with its three quantitative principles to break down this level, concluding that the market had reached a critical time window: whether the bull-bear transition could continue depended on whether two subsequent conditions would materialize. Before those conditions were confirmed, we still characterized this rally as an oversold bounce and cautioned against premature optimism.
On the daily chart, BTC began its correction on September 21, and by the previous weekly review it had been running for nearly 50 trading days without a single meaningful minor-degree corrective bounce. The price was then approaching the $72,500–$73,000 zone, where three layers of support converged: the ascending trendline (around $72,000), the 0.5 Fibonacci retracement level ($72,610), and the "Shijie Ribbon Model" (72,510–73,120). We judged at the time that absent external news disruptions, there was a high probability the market would stabilize here and launch a minor wave-ii bounce.
That did not happen. Last week, systemic risk suddenly intensified, and a single high-volume long bearish candle broke through the aforementioned supports, followed by a straight three-day plunge as market sentiment rapidly sank into extreme fear. The weekly candle closed with a 13.98% loss, a massive bearish bar, and the price effectively broke below the 52-week MA. At this point, the bull-bear transition was declared a failure, and the market returned to a bear market.
Altcoins were not spared either. HYPE fell 8.61% for the week with an amplitude as high as 27.92%, at one point dropping to $60 intraday before closing at $68.11, just barely holding above the long-term ascending trendline, leaving bulls a sliver of hope.
With the market having taken such a sharp turn, the questions now are: Where will BTC's decline stop? Has a major inflection signal already appeared? Can HYPE's long-term uptrend hold? This week's review will break these down one by one using Chan Theory market structure, the "Daily Inflection Monitoring System," and the three-line support system, and provide this week's actionable strategy.
Summary of This Week's Core Trading Views:
• Bitcoin weekly-level market structure analysis (see Part One for details)
• Bitcoin daily-level market structure analysis (see Part Two for details)
• Bitcoin's outlook for this week and medium-/short-term trading strategy (see Part Three for details)
• HYPE daily-level market structure analysis (see Part Four for details)
• HYPE's outlook for this week and short-term trading strategy (see Part Five for details)
I. Bitcoin Weekly-Level Market Structure Analysis
After the close on November 1, BTC's weekly closing price came in at around $74,900, settling near the 52-week MA (around $76,100). At that time, we applied the three quantitative principles of our proprietary [52-Week MA Confirmation Method] (detailed in the previous weekly review) to conduct a detailed analysis of the nature of the market trend, reaching a clear judgment: after running above the 52-week MA for eight consecutive weeks, the price pulled back to test this average, indicating the market had entered a critical time window. We noted then that whether the bull-bear transition phase would continue depended on whether two subsequent conditions would materialize, and on that basis we still characterized the market as an oversold bounce.
Last week, driven by systemic risk, the price quickly broke through multiple support levels and plunged on heavy volume, with the weekly candle printing a massive bearish bar down 13.98%. With the price effectively breaking below the 52-week MA, the bull-bear transition was declared a failure, and the market returned to a bear market.
Below, we will use the Chan Theory analytical framework to break down the current weekly structure in detail.
1. Review of the August 24 Weekly
As shown in Figure 1, this was our first introduction of the Chan Theory technical framework to analyze BTC's weekly-level market structure. At that time, the market was running the (3-4) bounce segment, with the price approaching the upper boundary of the box (dashed frame) near $82,850. We held a clear view then: the area around this upper boundary constituted a short-term bull-bear watershed; even if the price briefly broke above it (upside pressure seen at $90,000), the probability was extremely high that the (3-4) bounce segment would terminate in this area, after which the market would likely run a potential (4-5) correction segment (marked by the green arrow in the chart), with the price pulling back again toward the mid or lower boundary of the box to seek support (see the August 24 weekly for details). Over nearly three months of market action, actual price behavior confirmed our judgment.
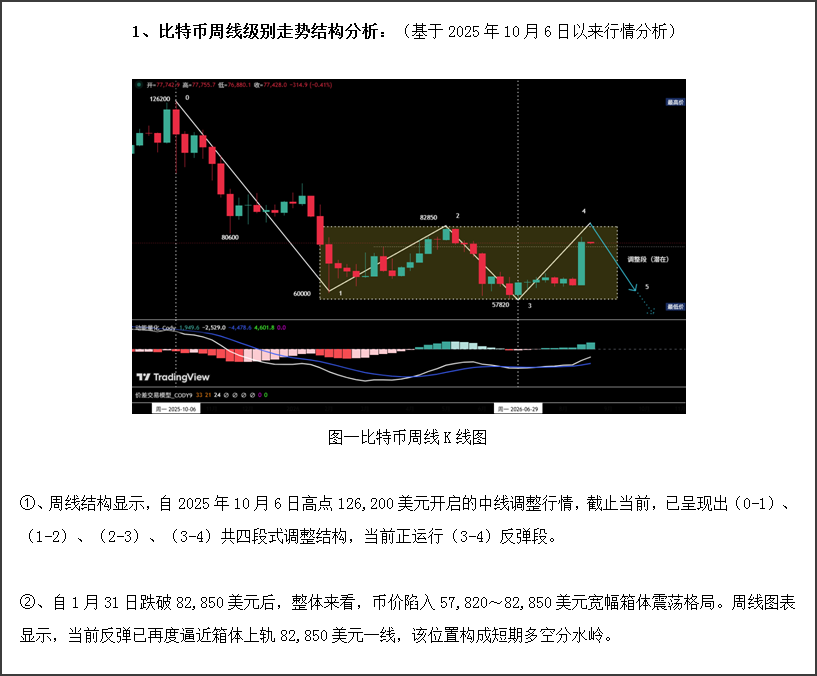 Figure 1: Weekly Review Image Display (August 24 Weekly)
2. Analysis of Current Weekly Market Structure
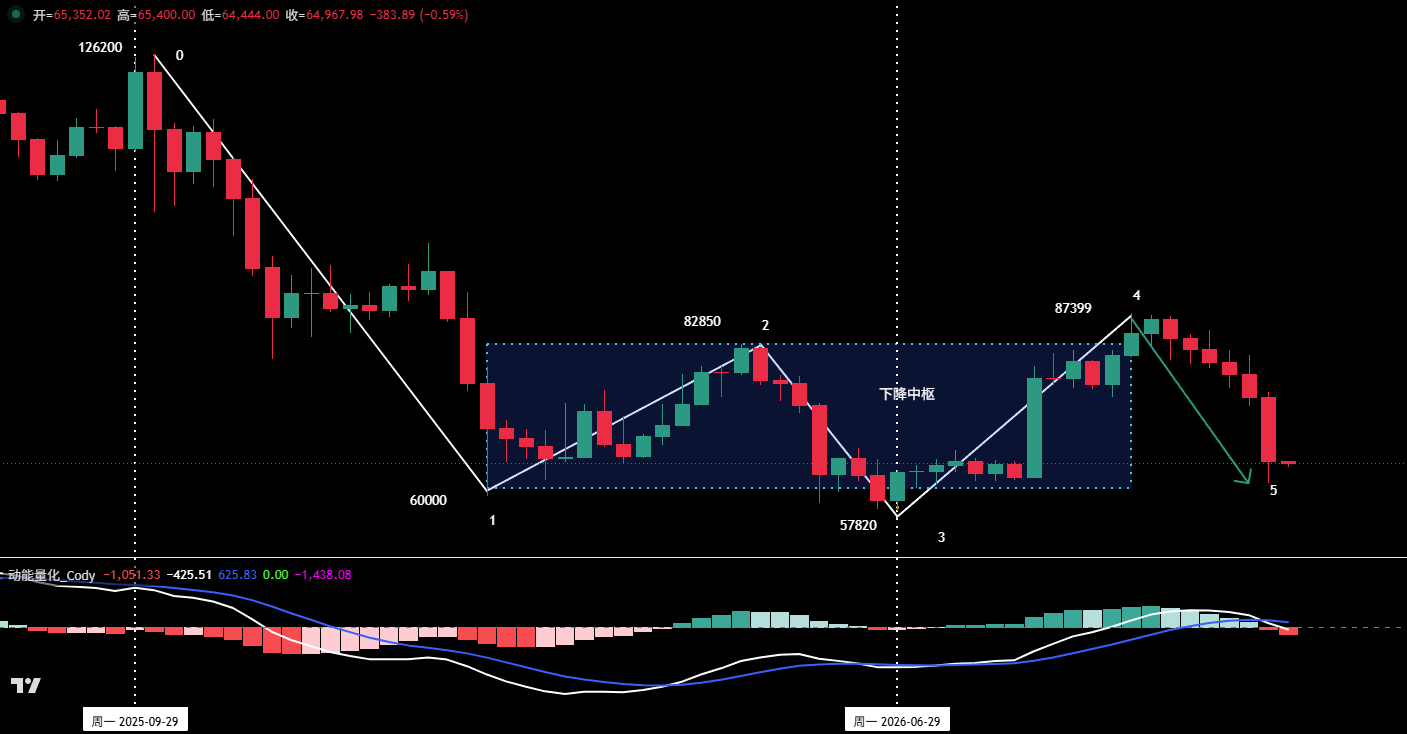
Figure 2: Bitcoin Weekly Candlestick Chart
①. Panoramic View of the Correction Structure
As shown in Figure 2, since the medium-term correction began from the October 6, 2025 high of $126,200, the weekly framework has presented a five-segment correction structure of (0-1), (1-2), (2-3), (3-4), and (4-5), and is currently running the (4-5) correction segment.
②. Construction of the Descending Central Zone
• Based on the overlap among the three segments (1-2), (2-3), and (3-4), a descending central zone is formed.
• Central zone upper boundary: around $82,850; lower boundary: around $60,000.
• The entering segment of the central zone is (0-1), and the potential exiting segment is (4-5).
③. Projection of the Potential Central Zone Exiting Segment (4-5)
Path One: Strong support exists near the lower boundary of the central zone. If endpoint 5 terminates near the $57,820–$60,000 area, it would indicate the central zone exiting segment has failed to form, and the market would likely maintain a box-range oscillation before choosing a direction after the oscillation ends.
Path Two: If endpoint 5 later breaks below the prior low of $57,820, it would indicate the central zone exiting segment has formed. However, based on our proprietary "Momentum Quantitative Model," once the price makes a new low for this correction, a relatively major bottom divergence will appear in terms of both downward momentum and volume. It therefore follows that even if a new low is made, the downside room is relatively limited.
II. Bitcoin Daily-Level Market Structure Analysis
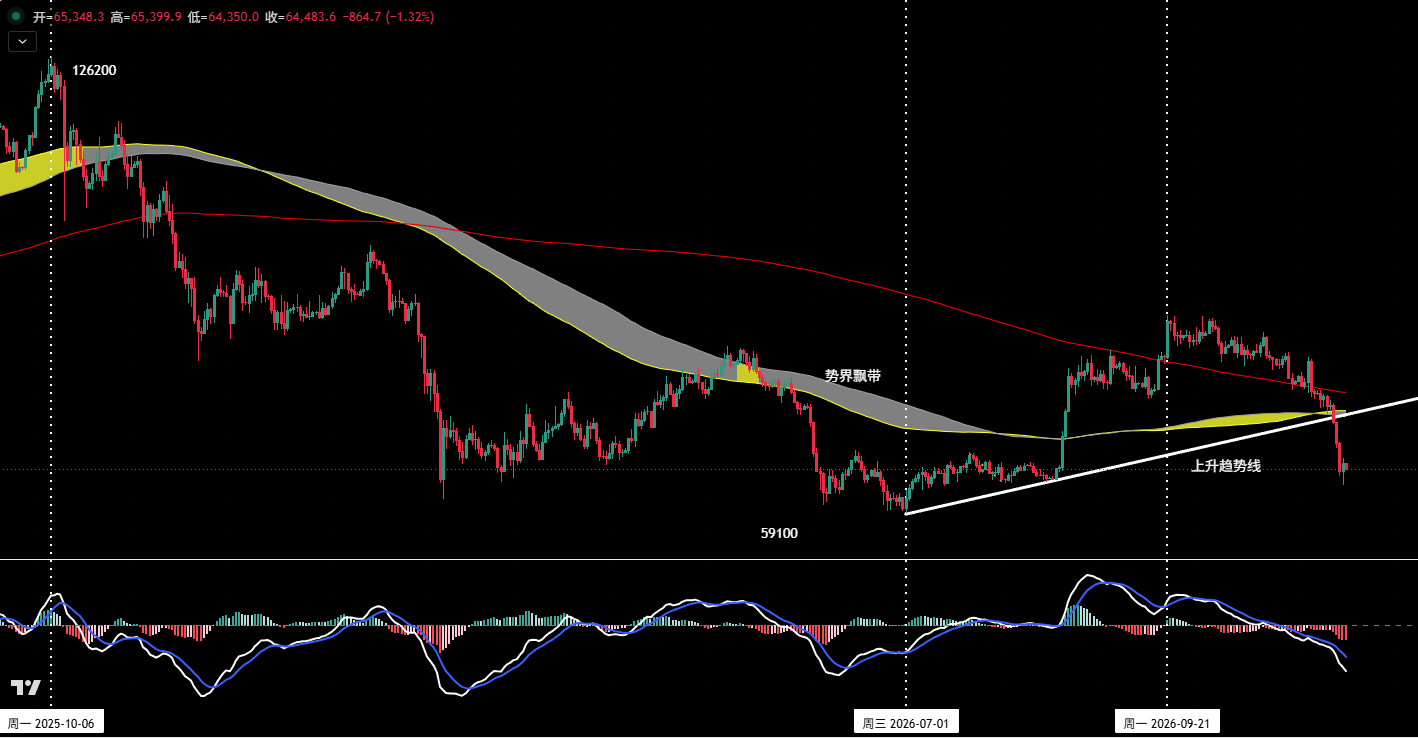 Figure 3: Bitcoin Daily Candlestick Chart
1. Review: Tracing Back to the Previous Weekly
As shown in Figure 3, the previous weekly review made the following judgment: BTC began its correction on September 21, and by then nearly 50 trading days had passed without a single minor-degree corrective bounce. At that time, the price was approaching the $72,500–$73,000 zone, nearing a dense cluster of multiple technical supports.
• Ascending trendline: Formed by connecting the July 1 low of $57,820 with several key stage lows, located around $72,000;
• Fibonacci retracement levels: 0.5 level at $72,610, 0.618 level at $69,120;
• Proprietary "Shijie Ribbon Model": Upper boundary at $73,120, lower boundary at $72,510.
Based on the above support structure, we believed at the time that absent external news disruptions, there was a very high probability the market would stabilize in this area and launch a minor wave-ii bounce.
However, that did not happen. Under the impact of systemic risk, a single high-volume long bearish candle broke through the aforementioned multiple supports, followed by a straight three-day plunge as market sentiment sank into extreme fear.
2. Proprietary "Daily Inflection Monitoring System": A Tool for Identifying Major Inflection Points
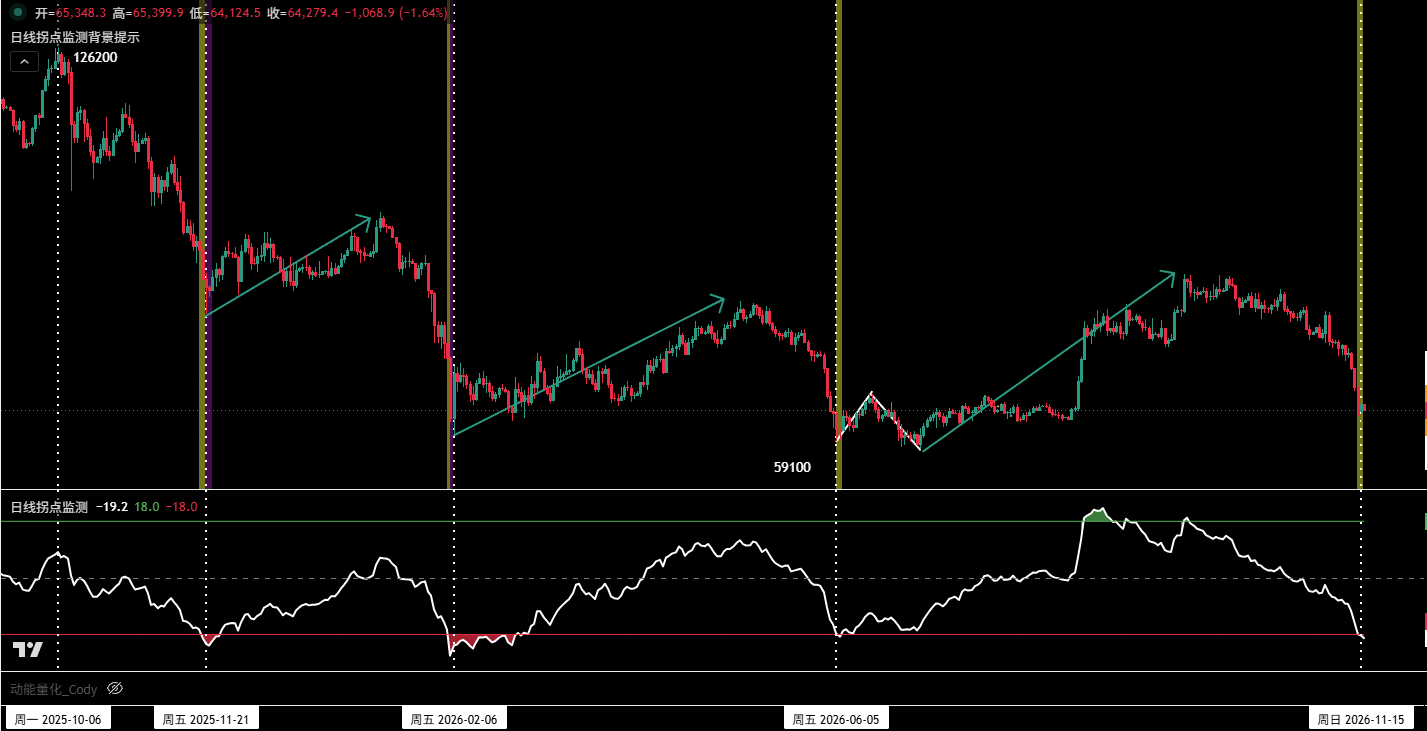
Figure 4: Daily Inflection Monitoring System
①. Model Composition and Applicable Scenarios
This monitoring system is built on energy changes across two dimensions—momentum and volume—and overlays a market fear index to form a top-and-bottom inflection monitoring model. The model is applicable to the daily-level environment and is specifically designed to capture relatively major inflection points; in extreme conditions of sharp declines or sharp rallies, its recognition performance is relatively better.
②. Explanation of Functional Signals
• Yellow background signal (daily bottom zone): When the market experiences a sharp decline, once the system detects that the price has entered a daily-level bottom zone, it issues a yellow background signal on the candlestick chart and simultaneously displays the corresponding value.
• Purple background signal (deep bottom zone): When the market experiences a sustained decline, once the system detects that the price has entered a deep bottom zone, it issues a purple background signal on the candlestick chart and simultaneously displays the corresponding value.
3. Case Studies
As shown in Figure 4, since BTC began its correction from the October 2025 high of $126,200, the "Daily Inflection Monitoring System" has captured and validated three major inflection points, with a success rate of around 70%. It has now received a fourth signal.
①. Case Study One
• Time: November 21, 2025
• Stage low: around $80,636
• Background signal: yellow → purple
• (Inflection) Depth Index: -16.5 → -21
• Subsequent move: $80,636 rebounded to $97,925; over about 54 trading days, a gain of 21.4%.
②. Case Study Two
• Time: February 6, 2026
• Stage low: around $60,000
• Background signal: yellow → purple
• (Inflection) Depth Index: -16.5 → -24.7
• Subsequent move: $60,000 rebounded to $82,850; over about 89 trading days, a gain of 38.1%.
③. Case Study Three
• Time: June 5, 2026
• Stage low: around $59,111
• Background signal: yellow
• (Inflection) Depth Index: -17.7 → -18.7
• Subsequent move (in three phases):
Phase one: $59,111 to $67,300 (a bounce of about 13.85%);
Phase two: $67,000 to $57,820 (a retest of the low);
Phase three: $57,820 rebounded to $87,399; over about 108 trading days; a gain of 47.9%.
The two lows ($57,820 and $59,111) differed by 2.2% (about $1,291).
④. Case Study Four (Currently in Progress)
• Time: November 15, 2026
• Stage low: around $62,000 (not yet confirmed)
• Background signal: yellow
• (Inflection) Depth Index: -18 → -18.8
• Subsequent move: unknown.
III. Bitcoin's Outlook for This Week and Trading Strategy
1. BTC's Market Outlook for This Week
Core view for this week: Focus on whether the market can stabilize and find a footing in the $57,820–$60,000 area.
2. Key Resistance Levels
• First resistance zone: $67,300–$69,000 area (prior important level)
• Second resistance zone: $72,500–$73,000 area (prior important level)
• Third resistance zone: $75,500–$76,000 area (prior important level)
3. Key Support Levels
• First support: $60,000–$62,000 area (prior important support)
• Second support: around $57,820 (prior important low)
• Third support: around $54,500 (prior important low)
4. This Week's Trading Strategy (Excluding Sudden News Impact)
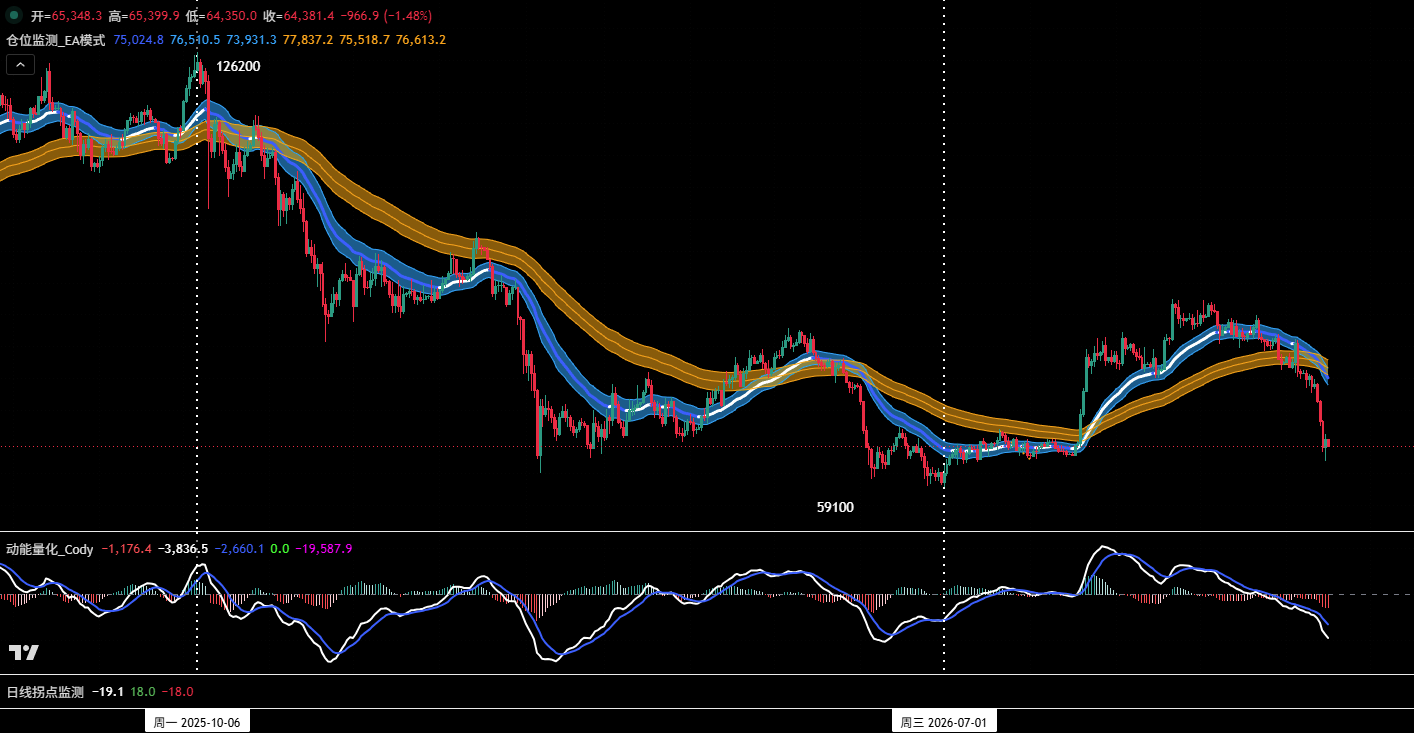 Figure 5: Bitcoin Daily Candlestick Chart (Position Monitoring Model)
①. Medium-Term Strategy: Stay in Cash and Observe
As shown in Figure 5, the price has effectively broken below the "Position Monitoring Channel." Given the current market environment and price level, the medium-term strategy is to stay in cash and observe for now.
②. Short-Term Strategy: Primarily Stay in Cash for Now
At the short-term level, we also primarily stay in cash, waiting for the market to establish a clear direction before acting.
IV. HYPE Daily-Level Market Structure Analysis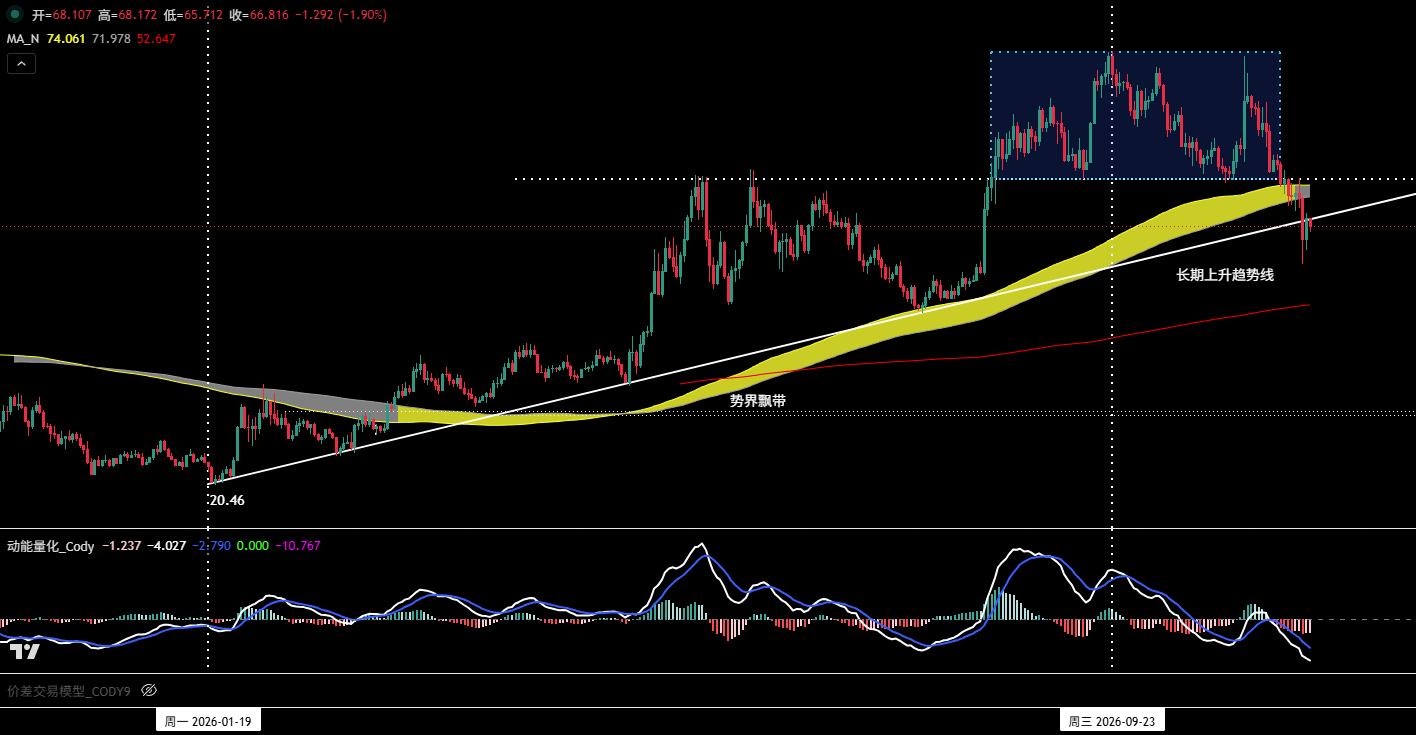
Figure 6: HYPE Daily Candlestick Chart
1. Last Week's Review: The Last Line of Defense Still Offers a Sliver of Hope
As shown in Figure 6, in the previous weekly review, we built a three-line support system "from trend direction to the bullish lifeline" to conduct a tiered assessment of where HYPE's price might find footing. The three lines of defense, from high to low, were:
①. Lower boundary of the box: around $75;
②. Proprietary "Shijie Ribbon Model": upper boundary around $74; lower boundary around $71;
③. Long-term ascending trendline: around $68.
Last week the market underwent a systemic correction, and HYPE was similarly hit. The closing price came in at $68.11, with an intraday low of $60; the weekly decline was 8.61% with an amplitude as high as 27.92%, and the weekly candle printed a bearish bar with a long lower shadow, closing precisely above the long-term ascending trendline, indicating that bulls still retain a sliver of hope.
2. Analysis of Current Market Structure
①. Last week's candle had a long lower shadow, with the shadow measuring $8 (about 12% of the closing price). A long lower shadow generally indicates strong buying support below and is a bullish resistance signal. However, one pattern warrants caution—guarding against a bearish counterattack, in which the price retests the low of the lower shadow (around $60) to confirm whether support at that level is valid. Therefore, a "lower shadow" does not equal "stabilization."
②. The current price has broken below the lower boundary of the "Shijie Ribbon," but has not yet entered the effective confirmation stage. We consistently treat the "Shijie Ribbon" as the criterion for determining trend direction. If the uptrend still exists, bulls should leverage the support of the long-term ascending trendline to counterattack and reclaim the ribbon's upper boundary as quickly as possible, thereby reconfirming a bull market; otherwise, the trend assessment will gradually weaken.
③. The long-term ascending trendline is the bulls' final barrier. As long as the weekly level has not broken below this line with a real body, the current market is still operating within the framework of an uptrend; conversely, if a subsequent weekly close effectively loses this line, then the rally that began from the January 21 low of $20.14 may come to an end.