




BTC daily correction in progress, HYPE short-term approaching a directional decision | Guest Analysis


- Core View: Bitcoin broke below the lower rail of the $82,500 box on October 8 with heavy volume, and the September 21 high is most likely already the end of this rebound; only one of the three principles of the 52-week moving average confirmation method is met, and the rebound since July should still be classified as an oversold rebound, with a bull market not yet confirmed.
- Key Elements:
- BTC bottomed at $80,400 before rebounding on shrinking volume back above $82,500, which is a pullback confirmation after breaking support, indicating insufficient willingness among bulls to push higher.
- The 52-week moving average is at around $78,000 and still trending downward, meeting only the price breakout principle, while both the retest confirmation and bull market confirmation criteria have not been met.
- Three weekly candles form a top fractal, and if this week breaks below $80,400, a weekly-level top pattern is likely to be established.
- After wave e ends, the daily level may unfold as a three-wave correction, with the first downward target initially around $78,000.
- HYPE broke below the lower rail of an ascending channel that had run for two months on the same day, entering a window for directional selection. If the lower rail is effectively lost, the correction target is seen at $75–$77.
- For the medium term, the strategy is mainly to stay in cash and wait; for the short term, a 30% position can be used to try shorting at $85,500–$87,500 or to short along the trend after a breakdown of $80,500–$82,500.
Bitcoin's price action saw a substantive change last week. On October 8, the price broke below the lower boundary of its box range at around $82,500 on elevated volume, touching a low of $80,400. Although it subsequently reclaimed the $82,500 level, the rebound came on notably shrinking volume, indicating weak bullish conviction. We mentioned two scenarios for the termination of wave e in our previous report, and the market is now gravitating toward the second: the September 21 high is most likely the endpoint of this rebound.
Zooming out to the weekly chart, only one of the three principles of the 52-week moving average confirmation method is currently satisfied. Strictly by our quantitative standards, the rebound since July 1 should still be classified as an oversold bounce and is not yet sufficient to confirm a bull market.
HYPE also broke below the lower boundary of its two-month ascending channel on October 8, entering a critical window for directional selection in the short term.
This week's review will continue to apply the existing analytical framework, focusing on answering three questions:
- Under the 52-week moving average standard, what kind of market is Bitcoin currently in?
- After wave e terminates, how will the daily-level corrective structure unfold?
- Facing a potential correction, how should mid-term and short-term strategies respond?
We will also provide specific observation points and contingency plans for HYPE during the pullback confirmation phase after its channel breakdown.
Summary of Key Trading Views for This Week:
• Assessment of Bitcoin's current market trend nature (see Part 1 for details)
• Bitcoin daily-level trend structure analysis (see Part 2 for details)
• Bitcoin weekly outlook and mid/short-term trading strategies (see Part 3 for details)
• HYPE daily-level trend structure analysis (see Part 4 for details)
• HYPE weekly outlook and short-term trading strategies (see Part 5 for details)
1. Assessment of Bitcoin's Current Market Trend Nature
1. In our weekly review published on August 31, based on analysis of nearly 9 years of Bitcoin market history, we proposed a simple and practical quantitative standard for trend assessment — the 52-week moving average confirmation method — and clearly defined its quantitative principles.
①. Price Breakout Principle (Bear to Bull): The weekly closing price breaks above the 52-week moving average and holds above it for 2-3 consecutive weeks; if it merely pierces through for a single week and then falls back, it is considered a false breakout.
②. Pullback Confirmation Principle: After the price has been trading above the 52-week moving average for a period (typically 5 weeks or more), a pullback confirmation move should ideally occur to further validate the breakout's effectiveness.
③. Bull Market Confirmation Principle: The price continues to trade above the 52-week moving average, and the moving average slope turns upward.
The above constitutes the three conditions for assessing a bull market environment. After more than 40 trading days, what changes have actually occurred in the market? What is the current nature of the market? With these questions in mind, we will conduct another careful examination of the market strictly based on the established quantitative standards.
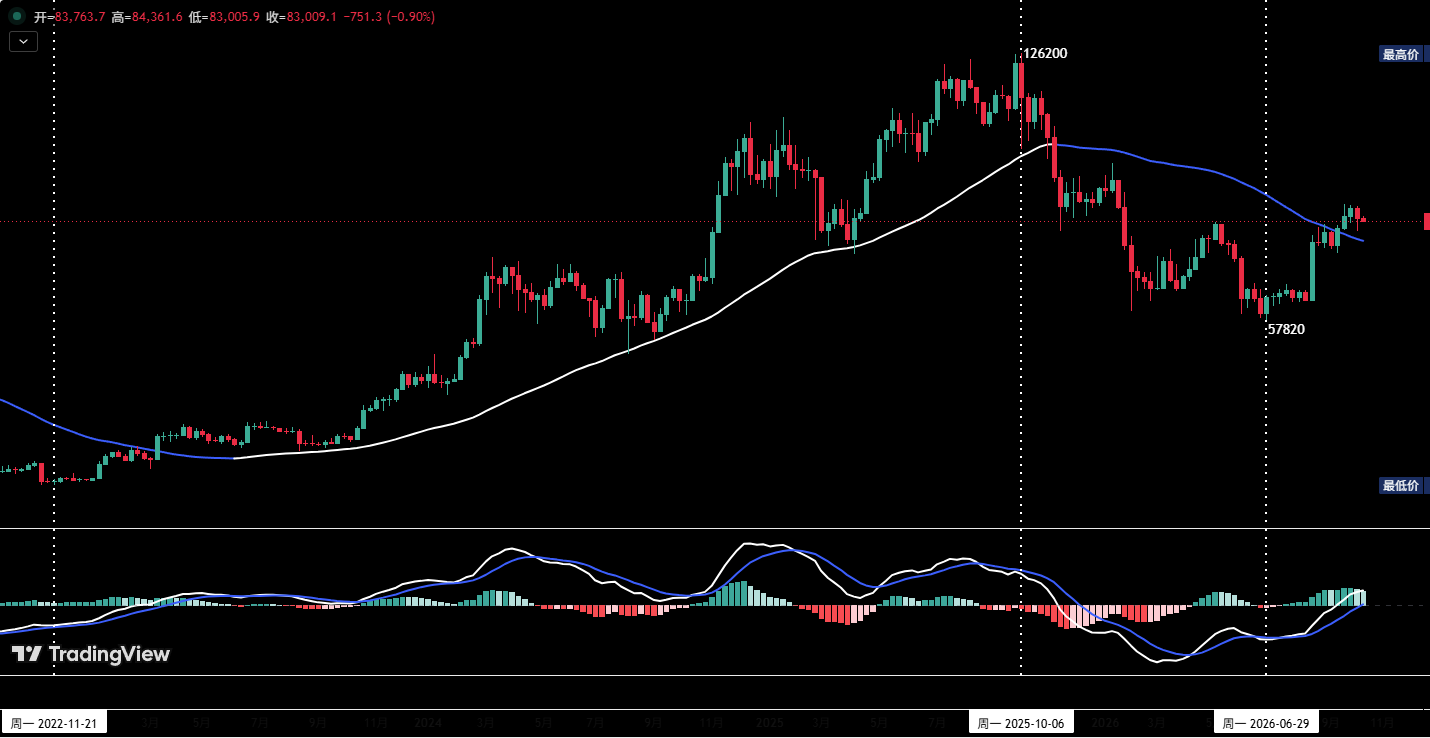
Figure 1: Bitcoin Weekly Candlestick Chart
2. As shown in Figure 1, under the weekly-level framework, the chart presents the following characteristics:
①. Since the weekly close on September 14, the price has successfully broken above and held the 52-week moving average (white-blue) for four consecutive weeks, basically satisfying the Price Breakout Principle.
②. When the price had been trading above the 52-week moving average for the 3rd week, a pullback to the moving average occurred. However, it still falls short of the established Pullback Confirmation Principle.
③. The 52-week moving average is currently at approximately $78,000 and remains in a downtrend.
3. In summary, the current market performance satisfies only one of the three principles, with the other two unmet. Based on this, we conclude:
①. The current rebound that began from the July 1 low of $57,820 should still be defined as an oversold bounce and is not yet sufficient to confirm a bull market.
②. Even if this rebound is later confirmed as a bull market Wave I (impulse) move (i.e., July 1 marks the termination point of the correction from $126,200), the 52-week moving average direction would still need to undergo a sequence of "downtrend → flattening → turning upward." It follows that the price will most likely maintain a range-bound oscillation pattern for some time, and the probability of a Wave II (corrective) pullback increases significantly.
2. Bitcoin Daily-Level Trend Structure Analysis
1. In our previous weekly review, we introduced the Elliott Wave theory framework to deconstruct the a→e five-wave rebound structure formed since BTC's July 1 low, and focused on analyzing two scenarios for wave e's termination:
①. If the price continues to rebound and refreshes the September 21 high, wave e has a very high probability of terminating in the $87,500–$90,000 resistance zone.
②. If the rebound fails to refresh the September 21 high, shows a spike-and-fade pattern, and effectively breaks below the key $82,500 support, the probability that the September 21 high constitutes wave e's termination point increases significantly.
Based on last week's actual price action, the probability of the market playing out the second scenario is increasing.
This week we continue to apply the previous analytical framework, focusing on: if the wave e rebound has already terminated on September 21, how will the subsequent market structure evolve.
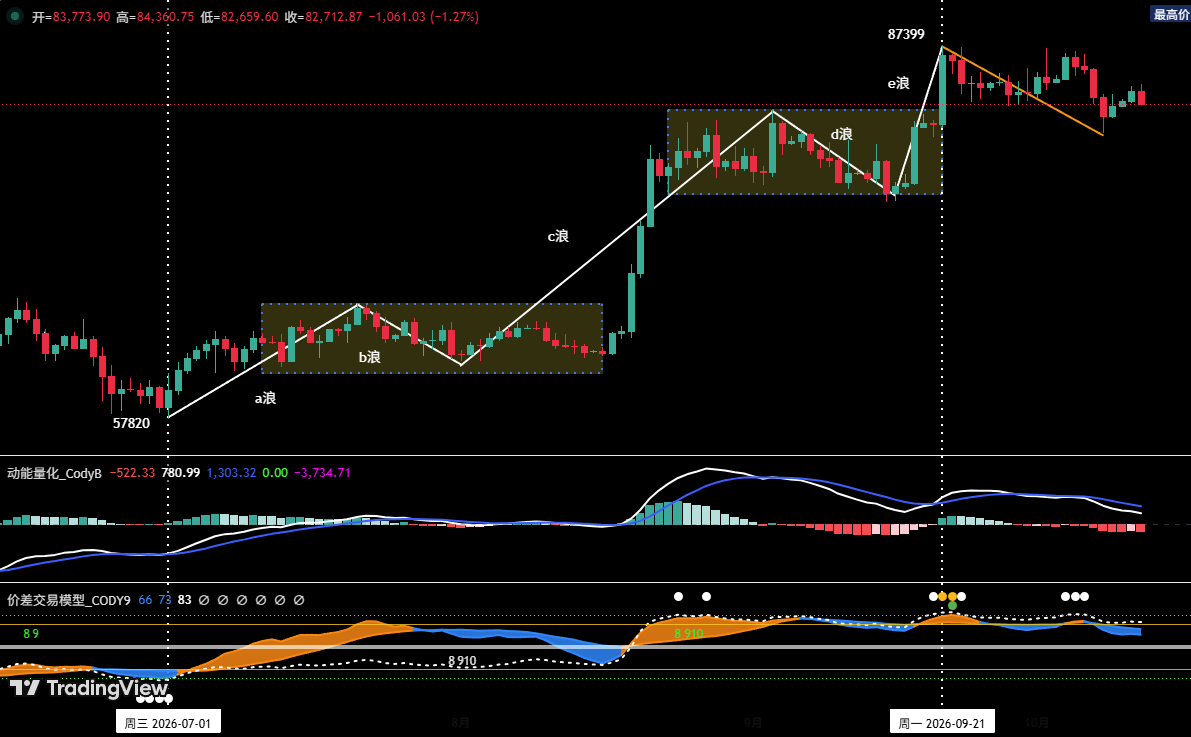
Figure 2: Bitcoin Daily Candlestick Chart
2. Last week's price action review and the rationale for concluding wave e most likely terminated on September 21:
①. Since the correction from the October 2 high (approximately $87,154), the price has generally shown a volume-price pattern of declining on rising volume and rebounding on shrinking volume, and on October 8 broke below the original box lower boundary (approximately $82,500), hitting a swing low of $80,400.
②. In the latter half of last week, although the price rebounded from the $80,400 low and reclaimed the $82,500 support, it did so on notably shrinking volume, indicating weak bullish conviction; the current price action can be viewed as a pullback confirmation after breaking below key support. As long as no volume-backed rally emerges, a correction could unfold at any time.
③. Technical indicators:
• Our proprietary "Momentum Quantitative Model" is currently showing a momentum top divergence;
• Our proprietary "Spread Trading Model" indicator remains in the high range. Once the price rises again, the top warning signal could be triggered anew at any time.
④. At the weekly level, after consecutive rebounds, the recent three weekly candles have formed a "top fractal" pattern; if this week's correction low further breaks below $80,400, the weekly-level top formation is highly likely to be confirmed.
⑤. In summary, there is an extremely high probability that wave e terminated on September 21.
3. Structural evolution of future market trends after wave e terminates
①. If wave e has terminated, the market is expected to enter a daily-level correction. At that point, a three-wave correction structure is the most likely form.
②. The current move can be defined as the first corrective leg, originating from the September 21 swing high of $87,399; it has now been running for 21 trading days, with the downside target initially at around $78,000.
③. After the Wave ⅰ daily-level correction ends, a Wave ⅱ rebound recovery is expected, followed by a potential Wave ⅲ correction, which will be analyzed in detail at that time.
3. Bitcoin Weekly Outlook and Trading Strategies
1. BTC Weekly Price Outlook
Core view for this week: Focus on target levels since the correction from the September 21 swing high.
2. Key Resistance Levels
• First resistance zone: around $85,500 (previous important level)
• Second resistance zone: $87,500–$90,000 area (previous important level)
3. Key Support Levels
• First support: $80,500–$82,500 area (previous important support level)
• Second support: $75,000–$78,000 area (previous important support level)
• Third support: $69,100–$70,500 area (previous important support level)
4. This Week's Trading Strategies (Excluding Impact of Breaking News)
①. Mid-term strategy:

Figure 3: Bitcoin _ Daily Candlestick Chart: (Position Monitoring Model)
Position Monitoring Model: As shown in Figure 3, the price has broken through the "Long-Short Channel" but has not yet entered the pullback confirmation phase. Therefore, the current mid-term strategy is to stay in cash and observe.
②. Short-term strategy: Use 30% of position, set stop-loss levels, and seek "spread" trading opportunities based on support and resistance levels. (Use 30-min/60-min as the operating timeframe).
③. In short-term operations, to dynamically adapt to complex market evolution, we have prepared A/B contingency plans in advance.
• Plan A: Light short position in strong resistance zone.
• Entry: If the price rises to the $85,500–$87,500 area early this week, shows a clear rejection and pullback pattern, and the quantitative model simultaneously issues a top signal, a short position of approximately 30% can be established.
• Risk control: Set an initial stop-loss level.
• Exit: When the correction reaches important support levels and combined with model signals, positions can be closed in batches to take profit.
• Plan B: Short on effective breakdown.
• Entry: If the price declines and effectively loses the $80,500–$82,500 support area, those without positions can establish a short position of approximately 30%.
• Risk control: Set an initial stop-loss level.
• Exit: When the price further corrects to important support levels and combined with model signals, positions can be closed in batches to take profit.
4. HYPE Daily-Level Trend Structure Analysis
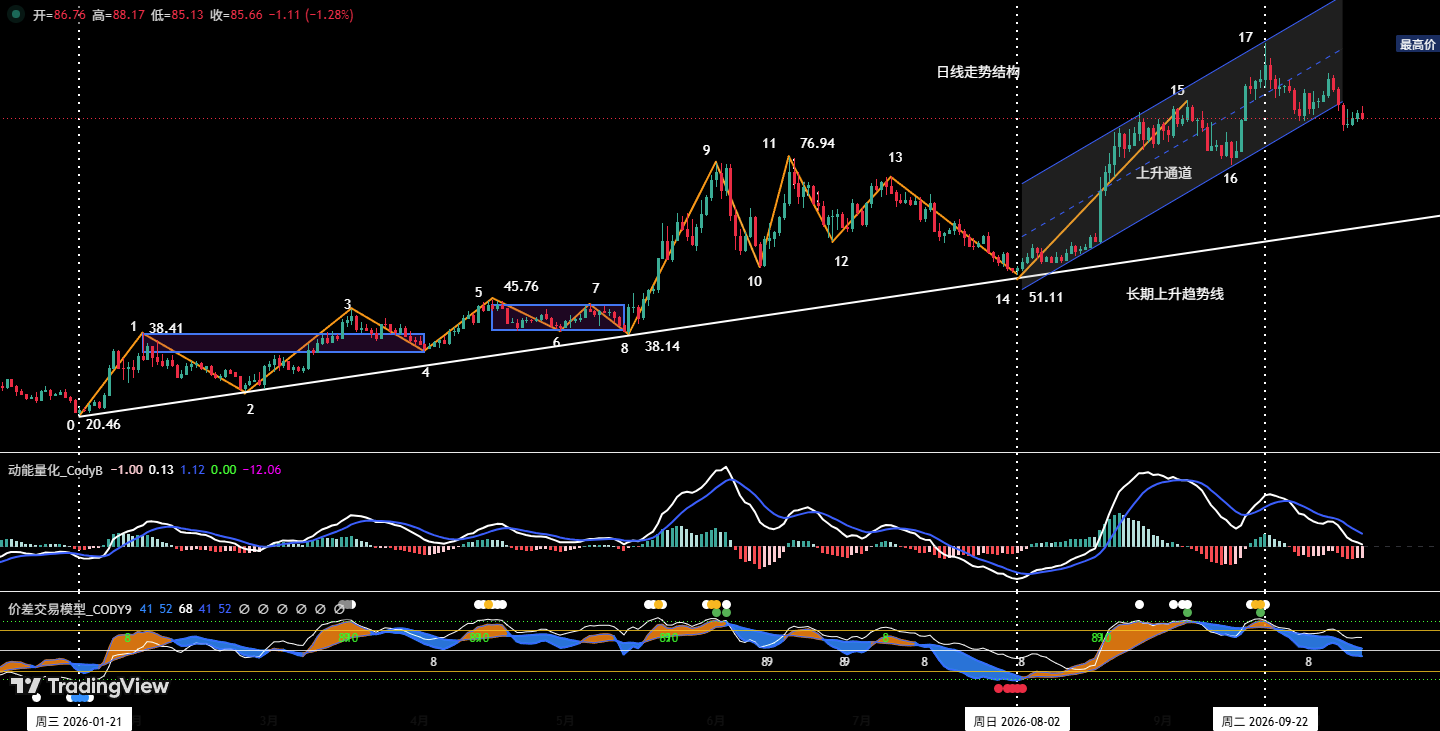
Figure 4: HYPE Daily Candlestick Chart
1. HYPE Last Week's Price Action Review
①. As shown in Figure 4, we clearly pointed out in our previous weekly review that: since HYPE began its current rally from the August 2 low of $51.11, the price has been trading along an ascending channel (the lower boundary is formed by connecting the August 12 and September 15 lows; the upper boundary is defined by connecting the August 22 and September 22 highs).
②. On October 8, HYPE recorded a medium bearish candle with a 4.82% decline, breaking below the ascending channel's lower boundary in one move. If it cannot reclaim the channel's lower boundary in the near term, it would indicate the price has shown signs of weakening.
2. Current Trend Structure Analysis (Figure 4)
①. At the daily level, the long-term uptrend line (white) remains intact, indicating the larger cycle is still in an uptrend.
②. From the daily chart, the price has broken below the original ascending channel's lower boundary and is currently in the pullback confirmation phase after the channel breakdown, at a critical juncture for short-term directional selection. If the price can reclaim the channel's lower boundary and continue rising, the short-term range-bound uptrend pattern is maintained; if it effectively fails to hold, this week will most likely see a correction pattern, with the next downside target at the $75–$77 area.
5. HYPE Weekly Outlook and Short-Term Trading Strategies
1. HYPE Weekly Price Outlook
①. Key Resistance Levels:
• First resistance: $88–$90 area
• Second resistance: around $94
• Third resistance: around $102
②. Key Support Levels:
• First support: $80–$82 area;
• Second support: $75–$77 area;
③. Core View for This Week:
Focus on observing the outcome of the battle when the price pulls back to the channel's lower boundary.
2. HYPE Short-Term Trading Strategies for This Week
①. Go light long on a successful hold of the channel's lower boundary.
If the price continues to rise this week and reclaims the channel's lower boundary, those without positions may consider a light long position. Position size should be controlled within 30%, with a stop-loss set and strictly enforced.
②. Go light long on effective strong support.
If the price continues to decline to the $75–$77 area and shows signs of stabilizing, those without positions may consider a light long position. Position size should be controlled within 30%, with a stop-loss strictly set and discipline enforced.
6. Special Notes
1. When opening a position: Immediately set an initial stop-loss level.
2. When profit reaches 1%: Move the stop-loss to the entry cost price (break-even point) to ensure capital safety.
3. When profit reaches 2%: Move the stop-loss to the 1% profit level.
4. Continuous tracking: Thereafter, for every additional 1% profit, move the stop-loss up by 1% accordingly, dynamically protecting and locking in gains.
Financial markets are ever-changing, and all market analysis and trading strategies require dynamic adjustment. All views, analytical models, and trading strategies in this article are derived from personal technical analysis and are for personal trading journal purposes only. They do not constitute any investment advice or operational basis. Markets carry risk; invest with caution. Please do not make decisions based on this article.