Christmas Rally or a Repeat of the 2000 Bubble? Wall Street's Two Great Historical Scripts Face Off


- Core View: Wall Street is facing a directional choice: Deutsche Bank, based on a century of data, is bullish on a year-end "Christmas rally," while BTIG warns of an impending reversal using the 2000 semiconductor bubble as a template. The core of the disagreement is that the current rebound lacks a genuine flush-out of positioning.
- Key Elements:
- Deutsche Bank, citing data since 1928, notes that the S&P 500's final bottom typically occurs around October 27, after which it largely rises one-way through year-end; in 21 of the past 23 midterm election years, the index rose in the three months after hitting its low.
- BTIG's Krinsky uses the 2000 Philadelphia Semiconductor Index as a template: that year the SOX plunged more than 55% from September to December, closely matching this year's trajectory, and he expects SOXX to rebound to 550-570 before reversing around midterm election week.
- Insufficient market clearing: only one S&P 500 sector—communication services—has an RSI below 49; the current put/call ratios of 0.59 and 0.87 are well below the 0.67 and near 1.0 seen at the March low, meaning hedging positions have not been bought.
- Microsoft's Azure beat expectations but orders were lackluster, with the stock up about 6%; Google missed on both revenue and profit, falling about 8%, with free cash flow negative for two consecutive quarters—neither flagship earnings report achieved a clearing effect.
- The Fed paused rate hikes but two votes favored an increase, and it incorporated AI memory demand into its inflation assessment framework—the memory boom could become a potential variable for monetary tightening.
- Deutsche Bank itself flags the risk: in the midterm election years of 1962, 1974, 2002, and 2022, markets all devolved into bear markets, and the average masks enormous dispersion.
Original Author: Xu Chao
Original Source: Wallstreetcn
As the Federal Reserve pauses rate hikes and tech giants' earnings reports land in quick succession, Wall Street stands before a historic choice: will the seasonal bullish pattern work once again, or is the ghost of the 2000 tech bubble bursting re-emerging?
Deutsche Bank and BTIG both dusted off the historical record this week, yet arrived at diametrically opposite conclusions. Deutsche Bank, citing nearly a century of market data, points to the inertial driving force of the year-end Santa Claus rally; BTIG Chief Technical Strategist Jonathan Krinsky, using the 2000 Philadelphia Semiconductor Index collapse as a template, warns that the market is approaching a downward turning point.
The collision of these two narrative frameworks is confronting investors with this year's hardest directional judgment call. Krinsky's core argument is not about the earnings numbers themselves, but about "the reaction to the reaction"—he believes this rebound lacks genuine capitulation, that complacency in the options market has yet to dissipate, which stands in stark contrast to the landscape before every genuine bottom in history.

The Historical Case for the Santa Claus Rally
Deutsche Bank's Jim Reid, in this week's daily chart, cited S&P 500 data going back to 1928, noting that in a typical year the S&P 500's final bottom tends to occur around October 27, after which "in the average year it is basically one-way up until year-end."

Reid further cited research by colleagues Binky Chadha and Parag Thatte: in 21 of the past 23 midterm election years, the S&P 500 posted gains within three months after its early-October low. The logic: election uncertainty fades, equities have already undergone a correction, and political gridlock is typically viewed by the market as a positive.
Reid described 2026's trajectory as a "mild version" of the midterm election playbook—the S&P 500 hit an all-time high on May 29, up about 11% year-to-date, but nearly five months later sits less than 1% below that peak. His conclusion was decidedly festive: "Seasonality is not destiny; the worries about Iran, AI, and France won't magically disappear. But if history is any guide, today is often the moment when the Santa Claus rally begins to heat up."
Still, Reid himself offered a clear risk warning: averages mask enormous dispersion—1962, 1974, 2002, and 2022 were all midterm election years that ultimately turned into bear markets. Among them, 2002 was precisely the year the 2000 tech bubble finally bottomed.
Krinsky's 2000 Template
Krinsky began tracking a historical analogue of the 2000 Philadelphia Semiconductor Index (SOX) as early as September. He noted that after the SOX peaked on March 14, 2000, some individual stocks continued to set new highs, but the index itself never looked back—a pattern closely matching this year's price action. In the 2000 version, the SOX fell from about 1,200 in early September to about 540 by early December, a decline of more than 55%, with no Santa Claus rally whatsoever.
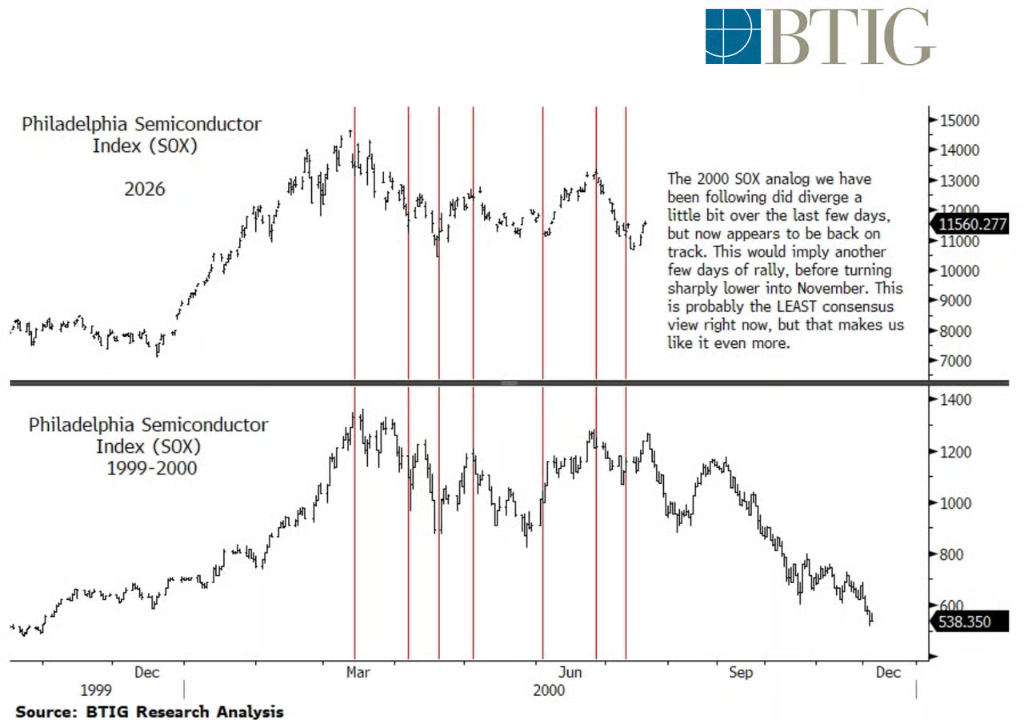
The template briefly diverged last week, but Krinsky believes it has now returned to form. He expects SOXX (the semiconductor ETF) to continue a modest rebound into the 550–570 range over the next few days, before reversing sharply around the midterm election week in November. He acknowledged, "This may be the most non-consensus view in the market right now, but that's precisely why we put more weight on it."
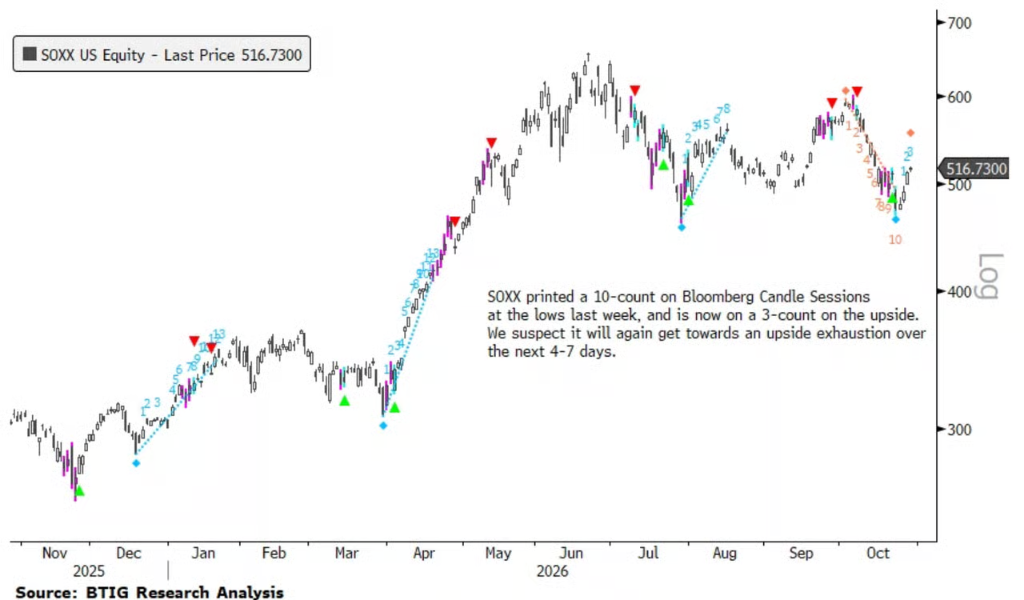
Technically, SOXX has found support near its 200-day moving average, but Krinsky lacks confidence that this line will hold. He believes SOXX will ultimately stall near the 200-day moving average around $475, while Bloomberg Candle Sessions' technical count shows the ETF triggered a 10-count low last week, is currently on an upside count of 3, and is expected to show another upside exhaustion signal within the next 4 to 7 trading days—a time window that lands squarely on midterm election week.
The Capitulation Event Has Yet to Truly Capitulate
Krinsky's core analytical framework is this: a genuine bottom rebound requires sufficient prior "capitulation." He believes the current market is far from meeting that condition.
At the sector level, of the S&P 500's eleven sectors, only communication services currently has a relative strength index (RSI) below 49. By comparison, on March 31 this year, only three sectors had an RSI above 50—the degree of oversold conditions is worlds apart.
The options market likewise shows no signs of panic. The current 20-day equity put/call ratio is 0.59, and the total put/call ratio is 0.87, whereas around the true market low in March this year, those ratios were approximately 0.67 and close to 1.0, respectively. Krinsky's conclusion: the hedging positions that typically flood in before a genuine bottom rebound were simply never bought this time.
At the hedge fund level, some degree of "cleansing" has indeed occurred. According to Nomura's Charlie McElligott, during October's AI "growth scare" and momentum factor unwind, roughly 100 multi-strategy fund managers were washed out, while others bought about $1.6 billion in delta of Mag7 call options on the day of the Fed decision. But Krinsky argues this precisely proves the point—the cleansing is still underway, and new bets are already entering.
The Earnings Season Reaction Test
The two mega-cap tech earnings reports so far this season have both failed to deliver a "capitulation" effect, instead confirming Krinsky's concerns.
Microsoft surged about 6% after hours, with its Azure cloud business beating expectations, but orders and backlog data were lackluster. Google, meanwhile, saw its shares plunge about 8% after both revenue and profit fell short of expectations, hitting their lowest since April; Google's free cash flow has now been negative for a second consecutive quarter, and it has joined Meta on the list of companies the market is "unwilling to pay for AI capex."
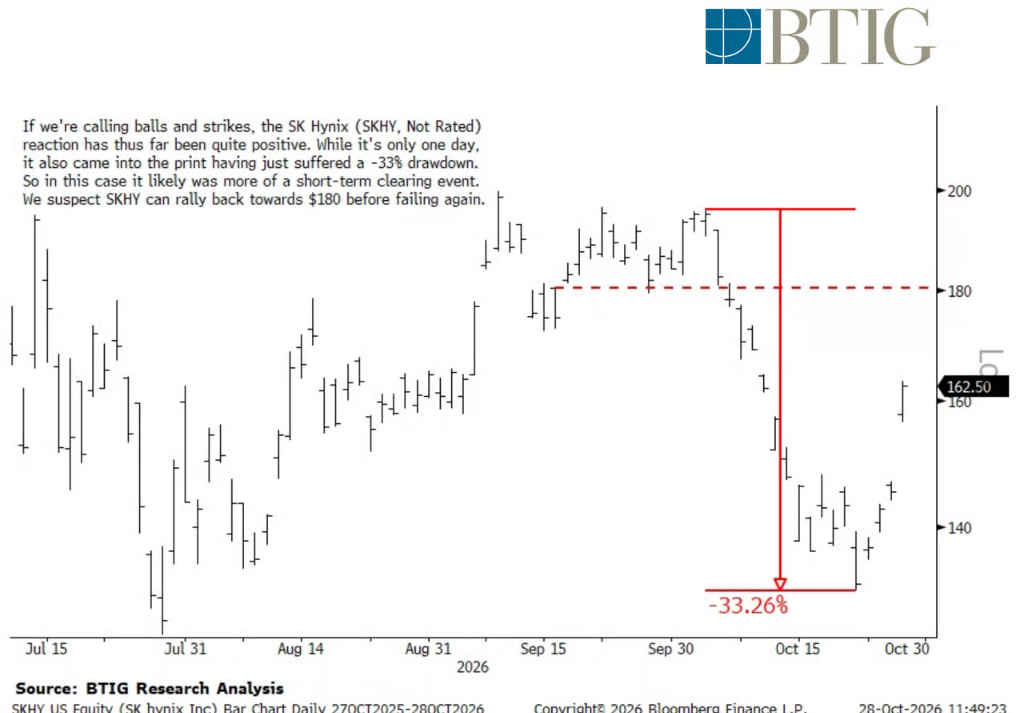
Korean memory chip giant SK Hynix's earnings were a rare positive case this season, driving a marked improvement in sentiment across related sectors. Krinsky acknowledged this was to some extent a genuine short-term capitulation event—SK Hynix had previously suffered a drawdown of about 33%. He believes its shares could rebound to around $180, but will then come under pressure again.
In addition, this Fed meeting also failed to provide directional guidance. The Fed paused rate hikes as expected, but Hammack and Lisa Cook both unexpectedly voted in favor of a hike; the Fed Chair held a hawkish press conference after the meeting, yet stocks still rose. Notably, the Fed has incorporated AI-related memory demand into its inflation assessment framework—meaning the memory boom currently driving the semiconductor rebound has, to some extent, become a potential variable in the Fed's monetary policy tightening.
Two Histories, One November
The divergence between the two narratives ultimately boils down to a methodological question: can the statistical regularity of 98 years of average data overcome a single but highly fitting historical analogue?
Deutsche Bank's data wins on sample size, but as Reid himself warned, averages obscure extreme outcomes. Krinsky's counterargument is that the statistical premises of the average year do not hold in 2026—the S&P 500 is less than 1% from an all-time high, the options market shows no panic whatsoever, only one sector is in oversold territory, and two flagship tech earnings reports were both sold off. When everyone is citing the same Santa Claus rally chart, the capitulation effect has already been exhausted by the expectation itself.
Under this framework, the clearest path for the current market may be: SOXX completes its final leg of the rebound over the next few days, touching the 550–570 range, then stages a directional reversal around midterm election week. But if Microsoft's rally persists and Google's decline is absorbed tomorrow, the Santa Claus rally script is not without room for a comeback. The answer may already be apparent in Friday's closing price.