With similarly strong profit growth, HSBC fell while Hengrui rose: What is the Hong Kong stock earnings season rewarding?


- Core Viewpoint: The Hong Kong stock earnings season shows that the market no longer simply rewards high growth rates, but prices "verifiability"—investors are more focused on the source of growth, the path to realization, and sustainability. One-off factors or order backlogs are unlikely to directly command a valuation premium.
- Key Elements:
- From October 20 to 23, the Hang Seng Tech Index fell 5.76% cumulatively, with southbound capital recording a net outflow of approximately HK$17.046 billion. Valuation, policy expectations, and capital flows combined to exert pressure.
- HSBC's reported profit before tax rose 32%, but after excluding the base effect of a US$1.421 billion legal provision, the actual increase was approximately 10%. Revenue fell short of expectations, and the stock dropped 5.56%.
- CATL's third-quarter revenue grew 58.58%, but net profit rose only 14.54%, and single-quarter operating cash flow fell 93.59% year-on-year. Revenue, profit, and cash flow did not move in sync.
- Hengrui Pharmaceuticals' single-quarter net profit rose 88.92%, and its stock price gained over 12%, but the high growth partially came from outbound licensing revenue, which carries quarterly volatility.
- WuXi AppTec's backlog stood at RMB 76.74 billion, up 36.4% year-on-year, and the company raised its guidance; ASMPT's new orders hit a record high, with a book-to-bill ratio of 1.69.
- China Shenhua's net profit rose only 3.2%, but operating cash flow increased 23.1% and the dividend yield was approximately 4.52%, indicating that the market also pays for certain cash returns.
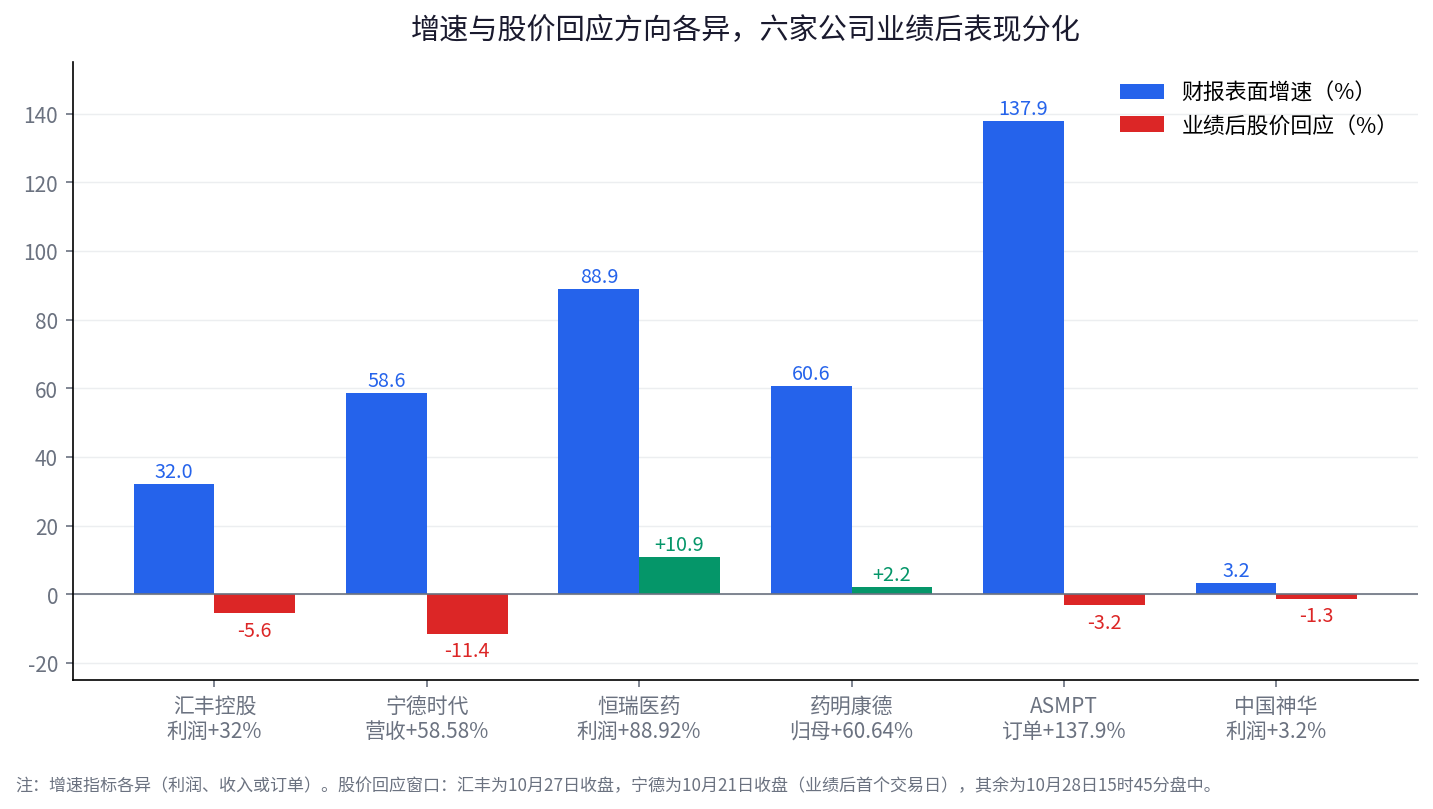
Comparison of the headline growth rates in the earnings of six companies and their post-earnings share price reactions. The growth metrics differ; the reaction windows are explained in the figure.
1. The faster the index falls, the more earnings reports must answer one question: how much is growth worth?
From October 20 to 23, the Hang Seng Index fell 4.52% cumulatively, and the Hang Seng Tech Index fell 5.76%. On October 22 alone, the Hang Seng Index fell 3.03% in a single day, and the Hang Seng Tech Index fell 5.03%. Over the same period, southbound capital saw net outflows of about HK$17.046 billion, with net selling on all four trading days. Tech stocks pulled back more sharply, showing that this round of pressure was not borne evenly by all assets; high-volatility growth stocks amplified their swings when risk appetite shifted.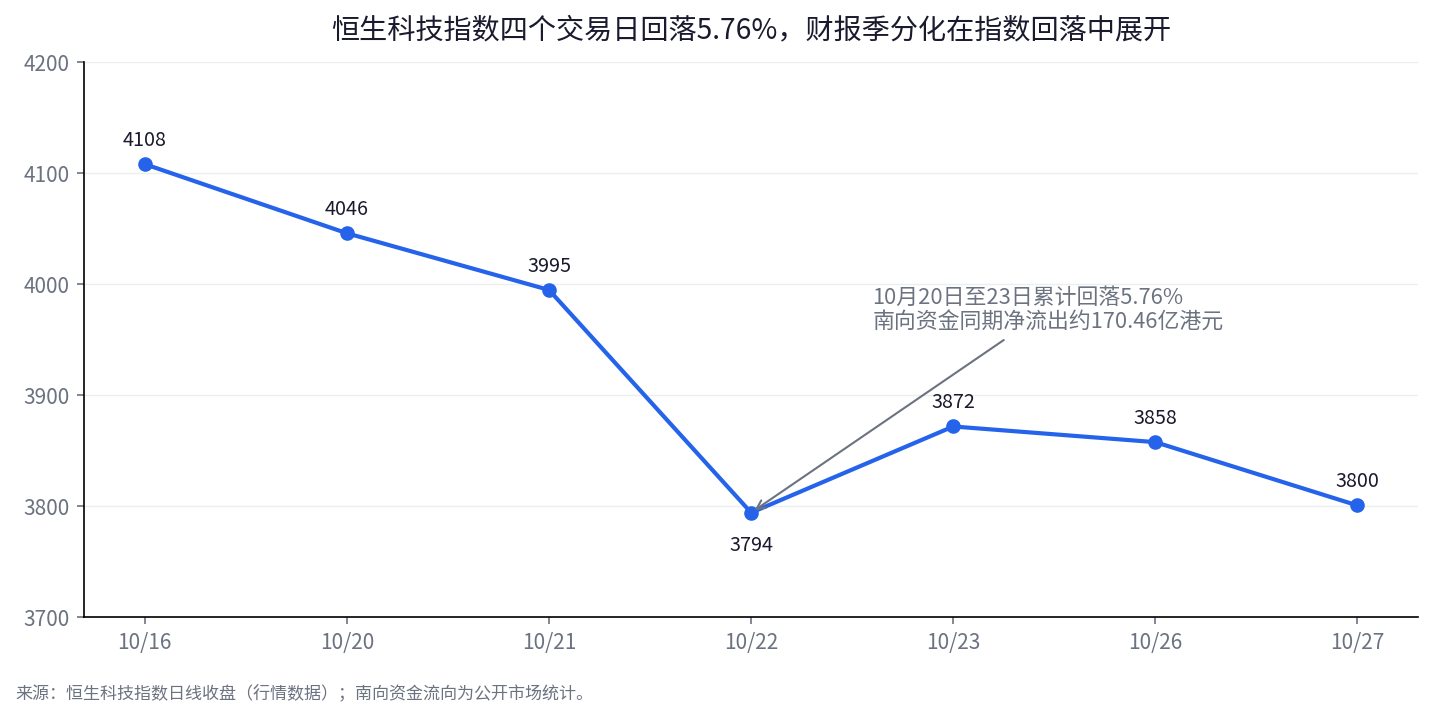
Closing trend of the Hang Seng Tech Index: it fell 5.76% cumulatively from October 20 to 23, while southbound capital saw net outflows of about HK$17.046 billion over the same period.
At least three forces are behind this. First, the global tech stock correction has reignited discussion about the return cycle on AI capital expenditure. In the past, the market was willing to pay high valuations for computing power, semiconductors and AI infrastructure because investors believed that today's investment would translate into future revenue and profit. When the scale of investment keeps expanding while commercialization returns still need time to be verified, valuations must be recalculated. AI demand has not disappeared; what has changed is the weight in pricing of the timing of revenue realization, profit margins and return on capital.
Second is the gap between policy expectations and actual data. When the market has already priced in the possibility of stronger stimulus in advance, even if economic data does not deteriorate, that may not be enough to push valuations higher. Share prices trade on changes in actual results relative to prior market expectations; isolated economic data itself does not provide the answer. Third, southbound capital has turned to net outflow, which increases adjustment pressure on sectors that had risen sharply earlier and have relatively concentrated holdings.
However, index pressure does not mean the market is uniformly bearish on growth. What really deserves attention is which companies' growth is still enough to convince investors when overall valuations come under pressure. Index pressure comes from three places: valuations, policy expectations and capital flows, while the real clue in earnings season is stock-level divergence. HSBC and CATL revealed the discount behind impressive numbers, while Hengrui Pharmaceuticals, WuXi AppTec and ASMPT demonstrated different types of growth evidence. China Shenhua further shows that what the market is willing to buy is not necessarily high growth, but possibly more certain cash returns.
2. HSBC's profit rose 32% yet the stock fell 5.56%: the market is unwilling to pay the same price for a one-off improvement
HSBC's third-quarter results did not look bad. The company reported pre-tax profit of US$9.632 billion, up 32% year on year. Profit after tax rose 38% to US$7.6 billion, and net interest income reached US$9.3 billion, up 6% year on year. The company also announced a third interim dividend of US$0.10 per share and plans to launch a share buyback of up to US$1 billion. But on the Hong Kong trading day after the results were published, HSBC's shares closed down 5.56% at HK$134.30.
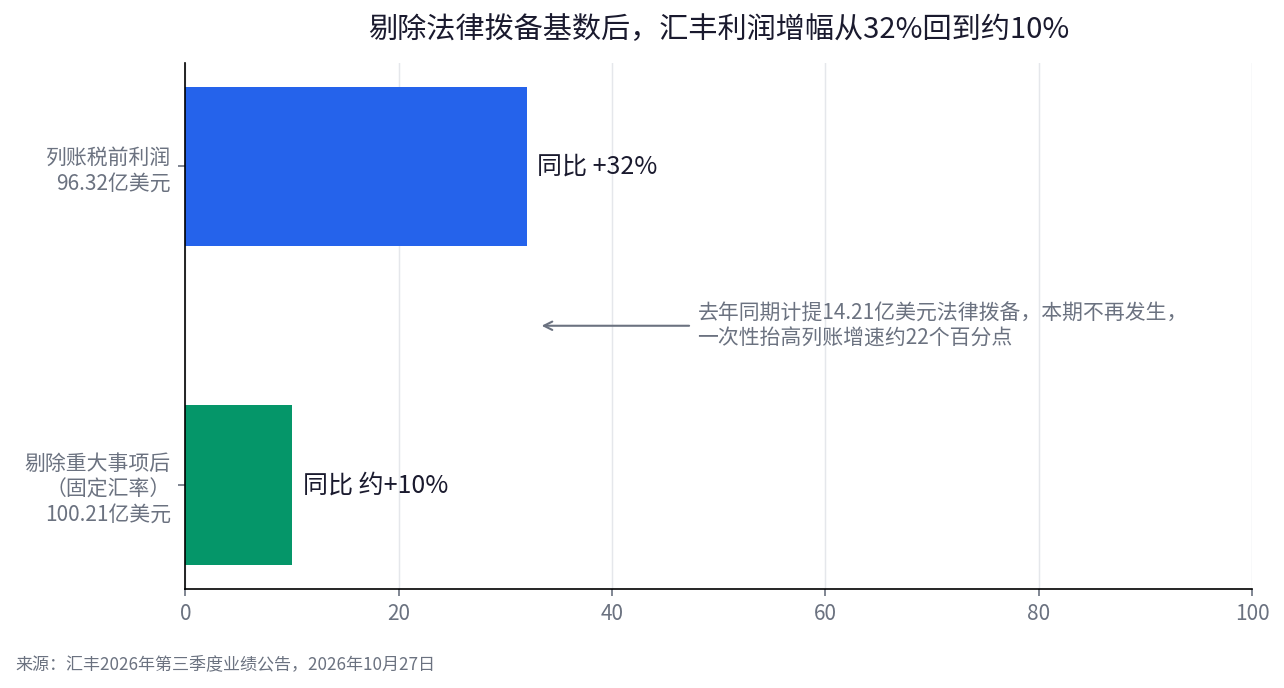
After excluding the base effect of US$1.421 billion in legal provisions, HSBC's profit growth falls from 32% to about 10%.
To understand this contrast, one must first break down the 32% profit increase. In the same period of 2025, HSBC booked about US$1.421 billion in legal provisions related to a claim linked to the Madoff fraud case in Luxembourg. There was no comparable expense in the current period, creating an obvious favorable year-on-year base effect. Excluding significant items and at constant currency, HSBC's third-quarter pre-tax profit was about US$10.021 billion, up about 10% year on year, a considerable gap from the reported 32%. At the same time, revenue was US$18.62 billion, up 4.7% year on year, below the market expectation of US$18.93 billion. Wealth management revenue was about US$2.7 billion, broadly flat year on year, with growth failing to extend the strong momentum of the previous two quarters.
This does not mean HSBC's operations suddenly deteriorated. Its net interest margin remained at 1.57%, annualized return on tangible equity was 17.7%, and dividends and buybacks also supported shareholder returns. The issue is that when investors look at an earnings report, they not only look at whether profit grew, but also judge the composition of that growth: how much came from operational improvement, how much came from last year's low base, and how much can repeat in future quarters.
HSBC's share price reaction precisely reflects the difference among these three. One-off provisions will not recur, which can lift current-period profit but will not repeatedly create equivalent returns every year. When revenue growth falls short of expectations, the market may downgrade its judgment on future earnings. Profit growth is a result that has already occurred; sustained profitability is what valuation is really paying for. The market had originally expected the company to further raise guidance, and no matter how impressive the reported growth rate was, it may not have been enough to support the share price.
3. CATL's revenue grew 58.58%, so why did the stock still come under pressure? The problem lies across the three financial statements
If HSBC's problem is how much of its profit growth came from one-off factors, then CATL faces another type of divergence that is more worth tracking: revenue, profit and cash flow have temporarily failed to grow in sync.
CATL's third-quarter operating revenue was RMB165.221 billion, up 58.58% year on year and up 11.8% quarter on quarter. Net profit attributable to shareholders was RMB21.246 billion, up 14.54% year on year, down 5.77% quarter on quarter from the second quarter, and below prior expectations from institutions such as Bernstein and Goldman Sachs. In the first three quarters, revenue reached RMB442.137 billion, up 56.19% year on year, and net profit attributable to shareholders was RMB64.530 billion, up 31.60% year on year. The trend of rapid revenue growth has not changed, but third-quarter profit growth clearly lagged revenue growth.
Cash flow data makes this discrepancy even more prominent. In the first three quarters, CATL's net cash flow from operating activities was RMB61.625 billion, down 23.60% year on year. Calculated by splitting the interim and third-quarter reports, third-quarter standalone net operating cash flow was about RMB1.409 billion, down 93.59% year on year, the lowest single-quarter level since the second quarter of 2018 and clearly below net profit for the quarter. Management explained that the cash flow change was related to adjustments in supplier payment policies, prepayments and other factors, while current-period profit was affected by changes in product mix and tax policy adjustments, and expected market demand to still have room for growth in 2027. The company subsequently disclosed a buyback plan of about RMB800 million for A-shares, but buybacks themselves cannot replace observation of operating data.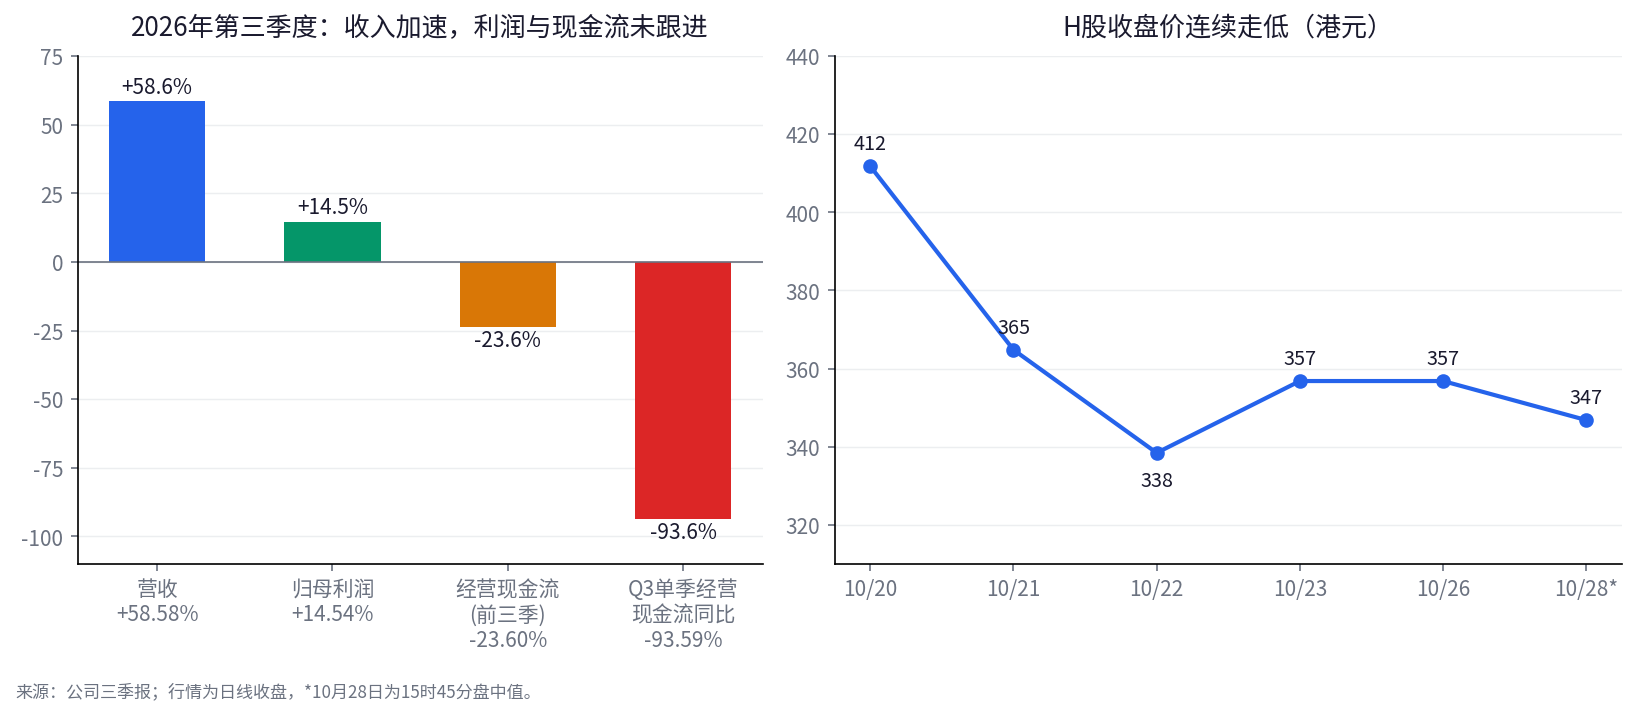
Comparison of CATL's revenue, profit and operating cash flow growth; the chart on the right shows the H-share closing price trend.
Share price performance reflected the market's caution toward these discrepancies. On October 20, CATL's H-shares closed down 6.58%. On October 21, they fell 11.41%, and on October 22, they fell 7.24%. As of 15:45 on October 28, the share price was HK$346.8, down about 0.5% from the previous trading day's close.
Here one cannot simply conclude that "cash flow fell, so growth quality deteriorated." Operating cash flow is affected by payment cycles, prepayments and changes in working capital, and single-quarter data can also fluctuate significantly. What really needs to be answered is three questions: whether revenue growth came from volume expansion or changes in product and pricing mix; whether profit growth lagging revenue is due to a temporary product portfolio or to competition and cost pressure; and whether the cash flow decline is a temporary disturbance caused by settlement timing or a more sustained change in the ability to convert profit into cash.
These three lines determine how subsequent earnings reports should be read. If revenue keeps growing, profit margins gradually stabilize and operating cash flow later recovers, the divergence this quarter may be more attributable to temporary factors. If revenue continues to expand while profit and cash flow lag for a long time, the economic value of that growth needs to be reassessed. For CATL, the most important task in the next stage is to prove that demand growth can translate into profit and ultimately into cash flow.
4. Hengrui Pharmaceuticals rose more than 12%: high profit growth is good news, but it cannot be directly extrapolated
Compared with HSBC and CATL, Hengrui Pharmaceuticals' earnings received a more positive market response. The company disclosed on the evening of October 27 that third-quarter operating revenue was RMB8.953 billion, up 20.55% year on year; net profit attributable to shareholders was RMB2.458 billion, up 88.92% year on year; and net profit attributable to shareholders after deducting non-recurring items was RMB2.514 billion, up 90.93% year on year. Third-quarter net operating cash flow was RMB5.857 billion, up 21.76% year on year. On October 28, Hengrui's H-shares rose by more than 12% at one point intraday and were up about 10.9% as of 15:45 at HK$49.58.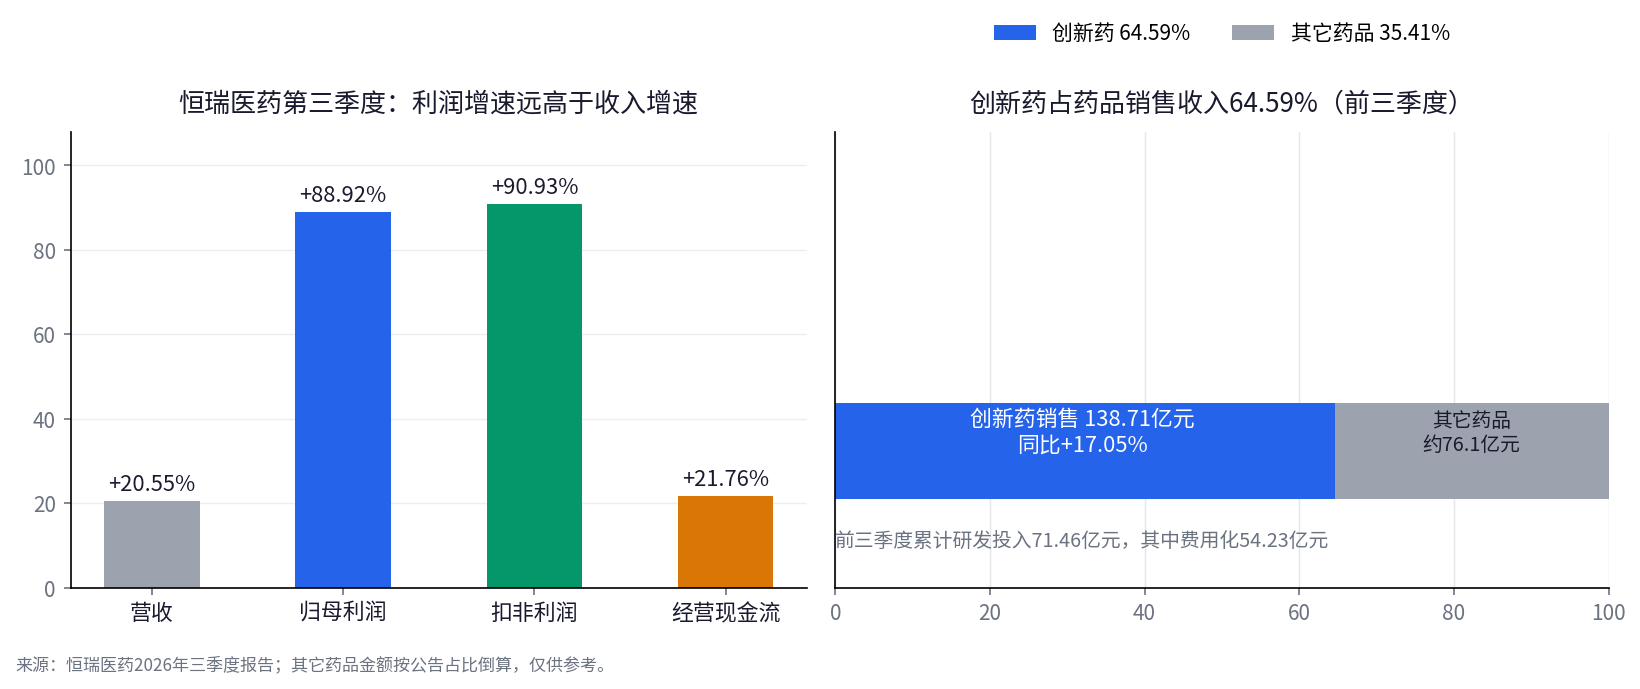
Growth rates of Hengrui Pharmaceuticals' four core third-quarter indicators; the chart on the right shows that in the first three quarters, innovative drug sales revenue accounted for 64.59% of pharmaceutical sales revenue, with the amount for other drugs back-calculated from the disclosed share.
But to understand this rally, one cannot look only at the 88.92% net profit growth rate. Hengrui's announcement shows that an increase in outbound licensing revenue was one of the important reasons for the high profit growth in the quarter. For innovative drug companies, revenue sources are not limited to drug sales; upfront and milestone payments from overseas licensing partnerships can also contribute revenue and profit. These partnerships can reflect the R&D value and potential commercialization space of products, but the timing of revenue recognition is uneven, and profit growth in one quarter cannot be directly extrapolated as the growth rate for every future quarter.
On the other hand, Hengrui is not entirely dependent on one-off licensing revenue. In the first three quarters, the company's innovative drug sales revenue was RMB13.871 billion, up 17.05% year on year, accounting for 64.59% of pharmaceutical sales revenue, with cumulative R&D investment of RMB7.146 billion. In the third quarter, the growth rate of net profit after deducting non-recurring items was close to that of net profit attributable to shareholders, indicating that the profit improvement was not entirely driven by non-recurring gains and losses.
Therefore, what is truly worth watching in Hengrui's earnings report is whether the three paths of innovative drug sales, R&D achievements and outbound licensing can form a mutually supporting profit structure. Drug sales provide ongoing operating revenue, R&D investment determines the future product pipeline, and overseas licensing may accelerate the commercialization of innovation results. Improvement across all three is more meaningful in the long term than a sudden jump in single-quarter profit growth.
Licensing revenue has another side: it can significantly lift current-period profit, but may cause quarterly volatility because of deal and recognition timing. If profit growth later slows, one cannot immediately conclude that operations have deteriorated, nor simply regard the current high growth as the norm; it is necessary to further distinguish changes in the base of licensing revenue, sustained growth in innovative drug sales, and whether R&D achievements can continuously translate into new partnerships and commercial returns.
Hengrui's rally shows that the market is willing to pay for growth in innovative drug companies, provided that investors can understand the source of growth and believe it has the possibility of continuing. What really determines pricing is whether different revenue sources can together constitute a sustainable profit model.
5. WuXi AppTec and ASMPT: orders provide the next stop for growth, but not a guarantee of realization
Hengrui proved that revenue and profit can be driven by multiple sources together, while WuXi AppTec and ASMPT offer another perspective: compared with single-quarter profit, orders and performance guidance can help investors judge whether future business activity is still expanding. But orders also have their limitations: receiving an order does not equal delivery, delivery does not equal high profit, and record orders certainly do not mean future revenue will necessarily grow by the same magnitude.
WuXi AppTec's first-three-quarter operating revenue was RMB45.537 billion, up 38.59% year on year. Net profit attributable to shareholders was RMB19.398 billion, up 60.64% year on year, and net profit after deducting non-recurring items rose 73.03%. Third-quarter net profit attributable to shareholders was RMB8.318 billion, up 136.67% year on year, including about RMB3.102 billion in one-off gains from the sale of part of its equity in associate WuXi XDC. The single-quarter net profit growth rate after deducting non-recurring items was 49.85%, which is more suitable for observing core business performance.
More worth tracking than single-quarter profit is the company's backlog of RMB76.74 billion as of the end of September, up 36.4% year on year, with a net increase of about RMB10.3 billion in the quarter. The company also raised its full-year revenue guidance from RMB58.5 billion to RMB60.5 billion to RMB61.0 billion to RMB61.9 billion, and raised its adjusted free cash flow expectation to RMB14.5 billion to RMB15.5 billion. Order growth, a revenue guidance upgrade and an improved cash flow expectation constitute a set of mutually corroborating signals: business demand is reflected not only in already recognized revenue, but also in the workload still to be delivered in the future.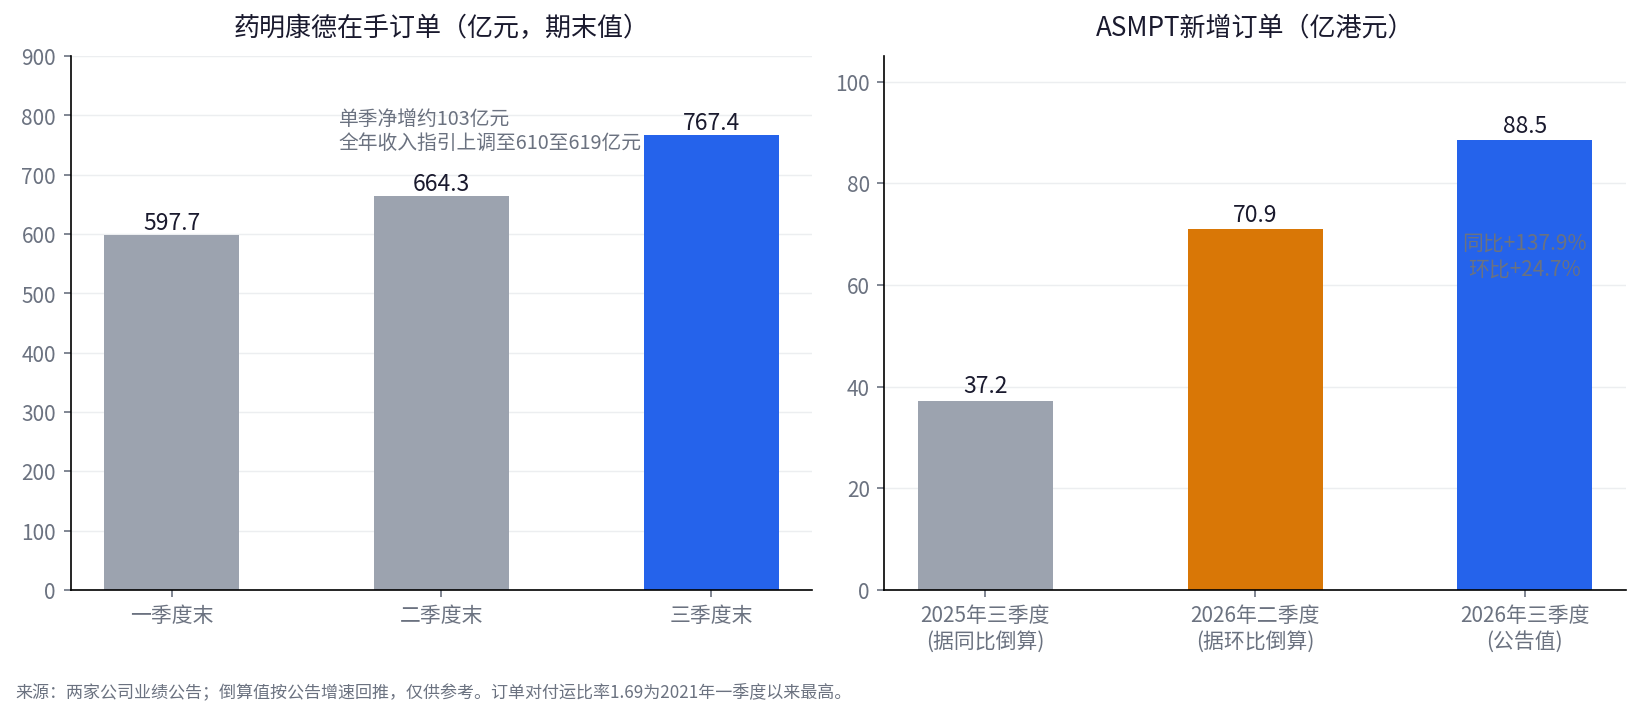
WuXi AppTec's backlog increased by a cumulative net amount of about RMB17 billion in the second and third quarters, while ASMPT's new orders in the quarter hit a record high; back-calculated values are derived from disclosed growth rates.
ASMPT's order data is even more prominent. The company announced third-quarter results on October 28, with sales revenue of HK$5.247 billion, up 48.7% year on year. Total new orders were HK$8.845 billion, up 137.9% year on year, a record high, and up 24.7% quarter on quarter. The book-to-bill ratio reached 1.69, the highest level since the first quarter of 2021. The company expects fourth-quarter revenue of US$670 million to US$730 million, which at the midpoint of the guidance range represents about 4.6% quarter-on-quarter growth and about 37.5% year-on-year growth.
These data provide more direct evidence of AI supply chain demand than conceptual narratives. For AI investment to translate into revenue for supply chain companies, customers ultimately still need to place orders, equipment needs to be delivered and revenue needs to be recognized. ASMPT's new orders and fourth-quarter guidance at least provide a trackable basis for business performance in the coming quarters. However, the company also noted that orders included one-off large orders and factors related to customers placing orders earlier because of longer delivery cycles. In other words, order growth is a real operating signal, but it should not be mechanically interpreted as future revenue growing 137.9% year on year.
Market reactions were not uniformly positive either. WuXi AppTec opened more than 4% higher after its results on October 27 and was up about 2.2% as of 15:45 on October 28. ASMPT opened nearly 5% higher on the day its results were announced, then pulled back in the afternoon and stood at HK$117.3 as of 15:45, down about 3.2% from the previous day's close. This reminds investors that even if operating indicators improve, share prices still depend on whether those improvements exceed prior expectations, whether valuations have already reflected them in advance, and how investors judge the realization pace of future orders.
What WuXi AppTec and ASMPT have in common is that they provide operating variables that can be continuously tracked: order scale, revenue guidance and cash flow expectations. Their difference is that WuXi AppTec's backlog more directly reflects the volume of business still to be executed in the future, while ASMPT's new orders require further observation of delivery cycles, customers placing orders early and product mix. In the next stage, whether orders can translate into revenue, whether revenue