Microsoft, Alphabet, and Amazon Earnings Preview: Three AI Monetization Paths — Who Is Closer to Delivering Returns?


Microsoft and Alphabet will report earnings after market close on Wednesday, October 28 (US Eastern Time), corresponding to around 4:00 AM Beijing Time on October 29; Amazon will report after market close on Thursday, October 29 (US Eastern Time), corresponding to around 4:00 AM Beijing Time on October 30.
After the earnings are released, prices will first react in after-hours trading. Please refer to each company's announcement for the exact release time.
Key takeaways:
- Microsoft: Can Azure growth and free cash flow both meet targets? The market is focused not only on cloud business growth, but also on whether the company can deliver on its commitment to turn free cash flow positive after continuously expanding computing capacity.
- Alphabet: Can high growth in the cloud business translate into profit? A $514 billion backlog provides revenue visibility, but continuously expanding computing investment and depreciation still require higher operating returns to absorb.
- Amazon: Can AWS's profitability improvement keep pace with expansion? Orders and revenue growth remain strong, but what truly affects medium- to long-term expectations is the relationship among future capital expenditures, AWS margins, and cash flow recovery.
- The same round of AI buildout, different financial constraints. Microsoft, Alphabet, and Amazon reported capital expenditures totaling approximately $134.9 billion in their most recent reporting periods. All three are expanding computing capacity, but the ways in which their investment returns are realized are not the same.
Beyond AI demand, the market is starting to ask each of the three companies for its own return formula
After Meta reported earnings last week, revenue and profit guidance came in above market expectations, yet third-quarter free cash flow fell to negative $2.12 billion, compared with positive $10.63 billion in the same period last year. Revenue growth and weakening cash flow appearing at the same time has shifted the market's focus on AI investment. Whether demand remains strong is still important, but when new investment will generate sufficient returns also affects valuations.
This week, Microsoft, Alphabet, and Amazon will report earnings in succession. All three are building AI infrastructure, yet they have different monetization paths. Microsoft relies on Azure to sell cloud computing power to enterprise customers. Alphabet both operates Google Cloud and uses infrastructure to transform its search and advertising businesses. Amazon needs to prove that AWS's growth and margin improvement are sufficient to support an ever-expanding investment plan.
These three models cannot be judged solely by the scale of capital expenditures. Order size determines how much visibility future revenue has, revenue growth reflects the speed at which demand is realized, profit margins determine the quality of growth, and cash flow tests how much return these investments can ultimately leave behind.
What is worth watching in this week's earnings is not so much who spends the most, but whether the three companies can each give clearer answers: who will pay for the new computing capacity, where profits will come from, and how long cash returns will take.
1. Earnings and the Fed decision coincide, and the market will calibrate growth expectations and funding costs at the same time
Microsoft and Alphabet are expected to report earnings after market close on October 28 US time, with Amazon following after market close on October 29. The Federal Reserve will hold its policy meeting from October 27 to 28, and the interest rate decision will also be announced within this window. Please refer to company announcements for the exact release times.
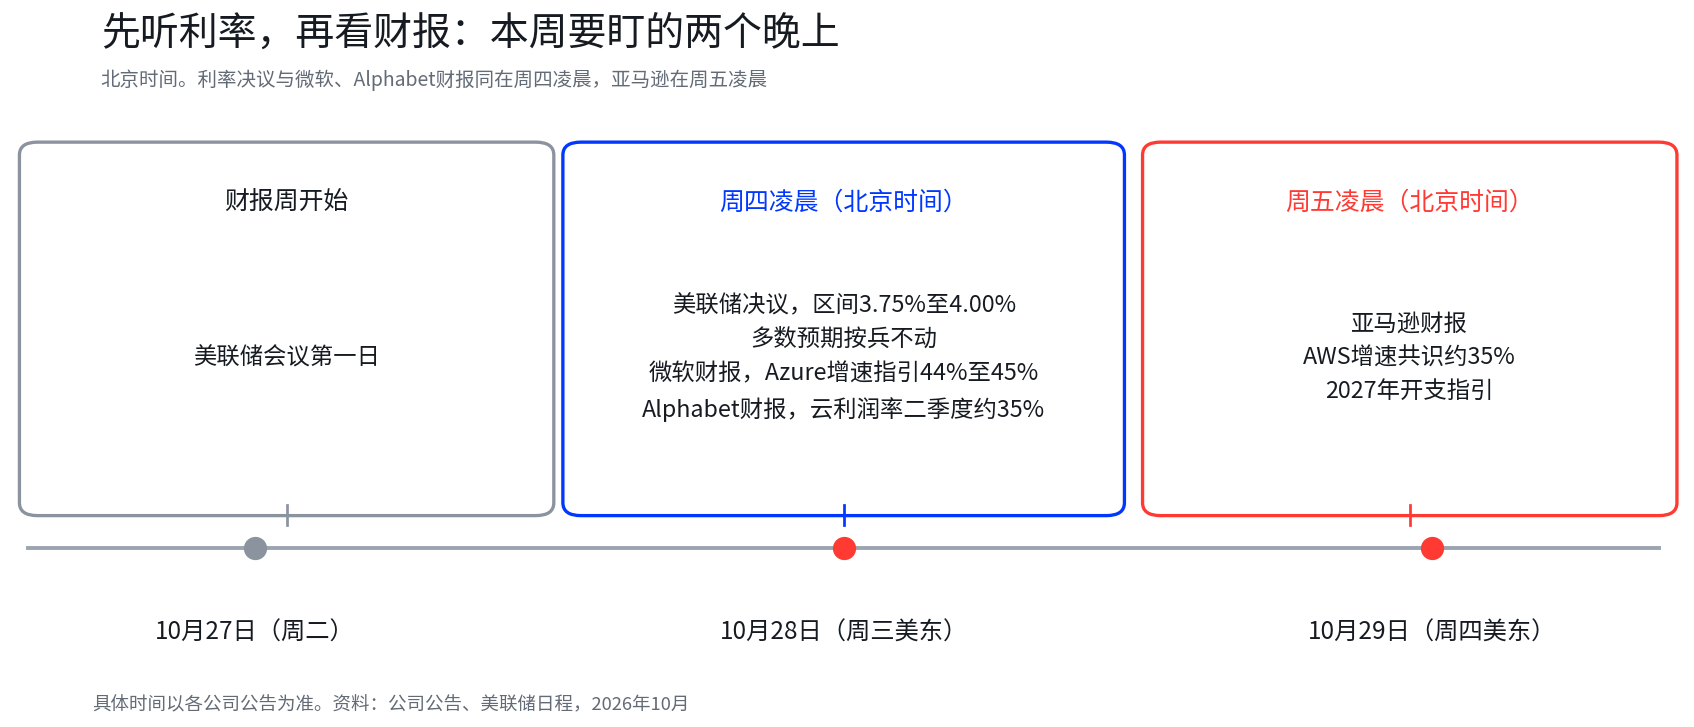 Chart: The rate decision and Microsoft and Alphabet earnings all fall in the early hours of Thursday, while Amazon's falls in the early hours of Friday. The chart marks the figures and reference ranges to check at each node. Please refer to each company's announcement for the exact times.
The target range for the federal funds rate is currently 3.75% to 4.00%. According to a Bloomberg survey as of October 23, most surveyed analysts expect the meeting to keep rates unchanged, with 8 of 64 respondents expecting a 25-basis-point hike.
Interest rates and earnings affect valuations in different ways, yet they converge at the same time. Interest rates affect the opportunity cost of capital and the returns investors demand, while earnings determine whether companies can support current valuations with stronger growth and cash flow.
If cloud business growth exceeds expectations and margins continue to improve, the market may be more willing to accept the cash flow pressure brought by earlier investment. Conversely, even if revenue keeps growing, as long as spending continues to accelerate while return guidance does not improve in tandem, investors may reassess the cost of expansion.
As of October 26, Microsoft closed at $532.60, up 1.54%. Alphabet closed at $316.80, down 1.06%. Amazon was at $249.42 in after-hours trading. Share prices before earnings have not yet given a clear direction, and the upcoming operating data and management guidance will become more direct pricing references.
2. After $134.9 billion in investment, the three companies' financial starting points are not the same
Microsoft, Alphabet, and Amazon reported capital expenditures totaling approximately $134.9 billion in their most recent reporting periods. Judging by the ratio of operating cash flow to capital expenditures, the pressure on the three companies already differs.
Chart: Operating cash flow is shown in blue bars, capital expenditures in red bars, and free cash flow in dark gray bars. The reporting periods are Microsoft FY2026Q4, Alphabet and Amazon 2026Q2, and Meta 2026Q3. Note: Free cash flow is calculated as operating cash flow minus capital expenditures and does not include principal repayments on finance leases. Meta's reported free cash flow was negative $2.12 billion, reflecting differences in the treatment of lease principal. Microsoft's reported capital expenditures for the same period were approximately $41 billion, also involving finance leases. Different statistical methods should not be directly mixed. Amounts are compiled from data interface data.
Microsoft's operating cash flow can still cover capital expenditures for the quarter, leaving $19.64 billion in free cash flow. Alphabet and Amazon had capital expenditures of $44.92 billion and $54.21 billion, respectively, exceeding operating cash flow for the period, and the short-term gap needs to be covered by cash reserves, financing, or other funding arrangements.
However, a single quarter of negative free cash flow does not mean that a company's overall cash-generating ability has deteriorated to the same extent. Over a longer observation period, the differences among the three become clearer.
Alphabet's full-year 2025 free cash flow was approximately $73.27 billion, and it still had approximately $4.26 billion in the first half of 2026. It turned negative in the second quarter, mainly reflecting the impact of a jump in spending on cash flow for the period. Amazon's full-year 2025 free cash flow was approximately $7.7 billion, then fell to negative $26.99 billion in the first half of 2026, and trailing four-quarter free cash flow has also turned negative, making its cash flow pressure more worthy of continued tracking. Meta's total free cash flow for the first three quarters was approximately $13.82 billion, with the negative value concentrated in the third quarter. Microsoft remained positive in each of the last four quarters.
Therefore, judging whether this round of investment is sustainable cannot rely only on the positive or negative sign of a single quarter. A more useful question is whether operating cash flow can grow in tandem as capital expenditures continue to increase, and how long it will take the companies to expand free cash flow again.
Spending is still climbing, and depreciation pressure will continue to pass through
Over the past six quarters, the four companies' capital expenditures have generally trended upward. Alphabet and Microsoft saw year-over-year increases of more than 100% in their most recent reporting periods, while Amazon and Meta saw increases of about 68% to 80%. This week's earnings will add the latest calendar third-quarter 2026 data for Microsoft, Alphabet, and Amazon.
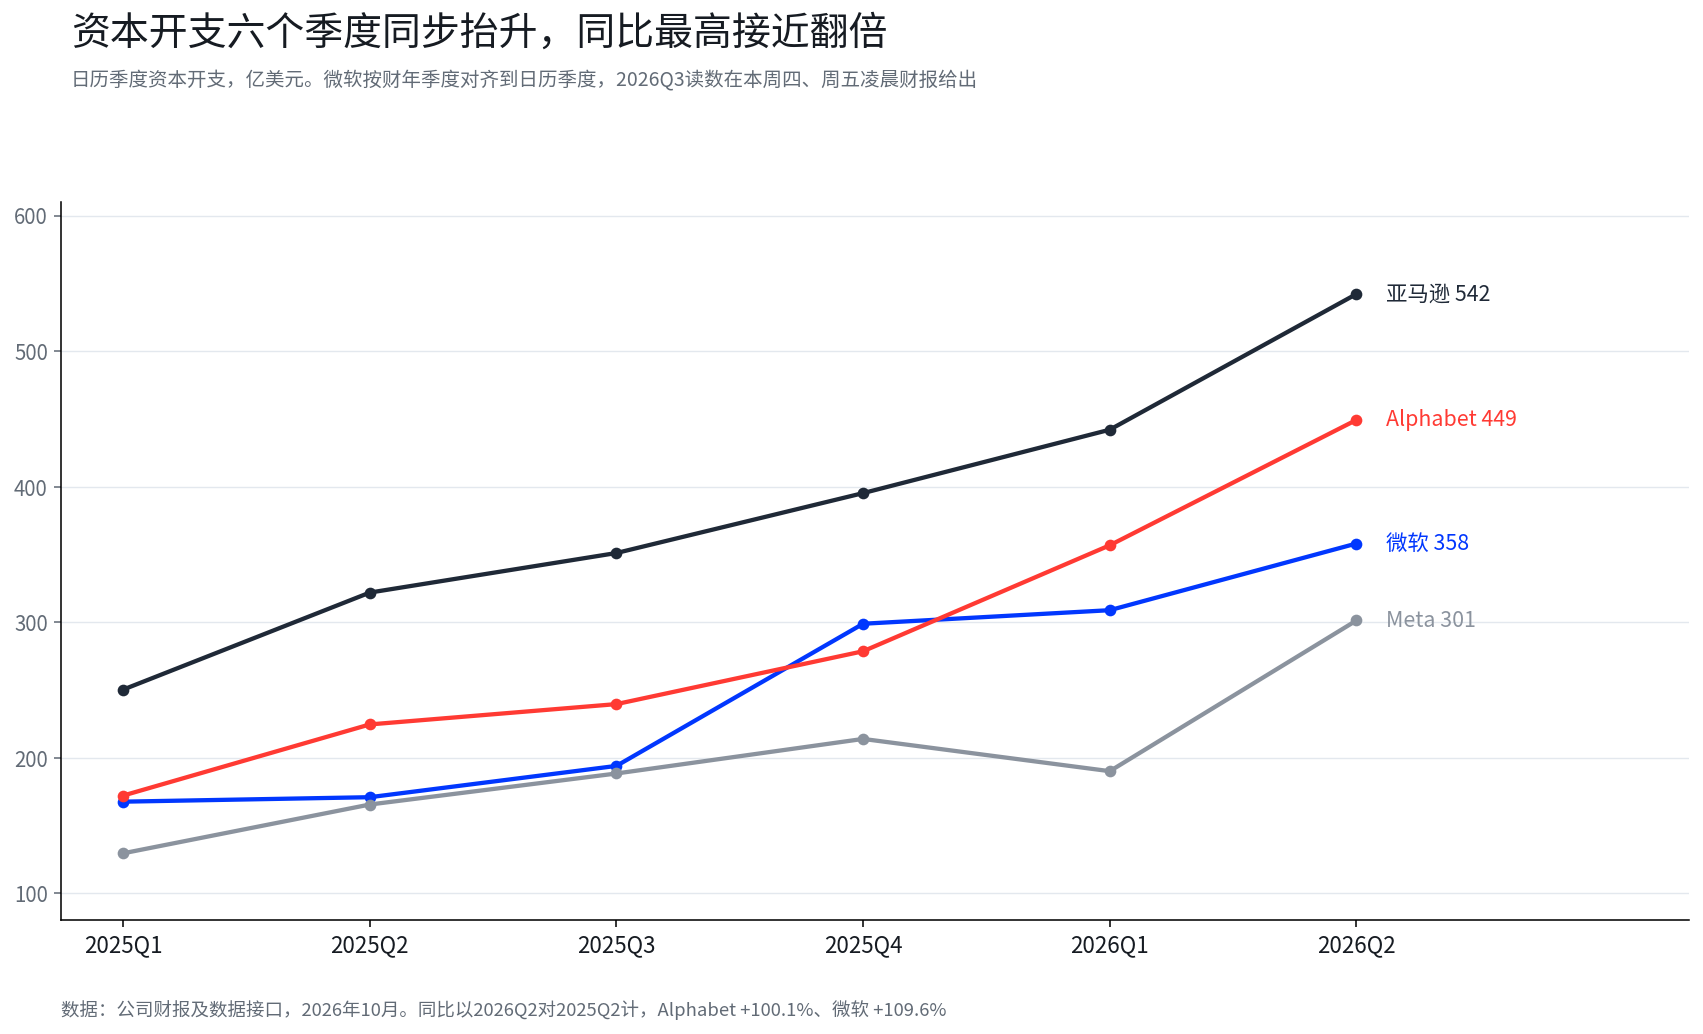
Chart: Calendar quarters from 2025Q1 to 2026Q2 are aligned; Microsoft's fiscal quarters are aligned to calendar quarters, so its calendar third quarter of 2026 is the first quarter of fiscal 2027. Amazon's operating cash flow is seasonal, with the first quarter being the low point of the year, so cross-quarter comparisons should preferably use full-year data.
The impact of spending does not end in the period when payment is made. Once data centers, servers, and other computing equipment are put into use, related costs will gradually be reflected in depreciation and amortization. The four companies' depreciation and amortization increased by approximately 17% to 44% year over year in their most recent reporting periods, with Alphabet and Meta both exceeding 40%.
This means that even if new computing capacity begins to contribute revenue, margins may not improve immediately. New revenue needs to cover operating costs and depreciation, and when financing scale expands, interest costs must also be considered. The time lag between investment and return is precisely the financial variable most worth watching in this round of AI infrastructure construction.
Sources of funding are also worth noting. According to company earnings data, Meta's long-term debt increased by approximately $22.2 billion in one quarter, rising from $58.74 billion to $80.92 billion. Changes in debt alone cannot prove that AI investment risk has risen, but when capital expenditures continue to expand, the combination of cash reserves, financing arrangements, and future cash flow will affect a company's ability to withstand fluctuations in the investment cycle.
Judging by the ratio of trailing four-quarter free cash flow to market capitalization, Microsoft is about 1.7%, Alphabet about 1.4%, Amazon about -0.4%, and Meta about 1.8%, based on closing prices on October 26. Over the same period, the US 10-year Treasury yield was about 4.96%.
These figures can only serve as a reference for valuation and cannot be used directly to conclude that Treasuries are more attractive than tech stocks. Treasuries provide contractually agreed interest streams, while stock cash flows may grow with business expansion and may also be affected by investment, competition, and financing costs. For tech giants, a lower current free cash flow yield means the market needs to see more convincing future growth to sustain existing valuations.
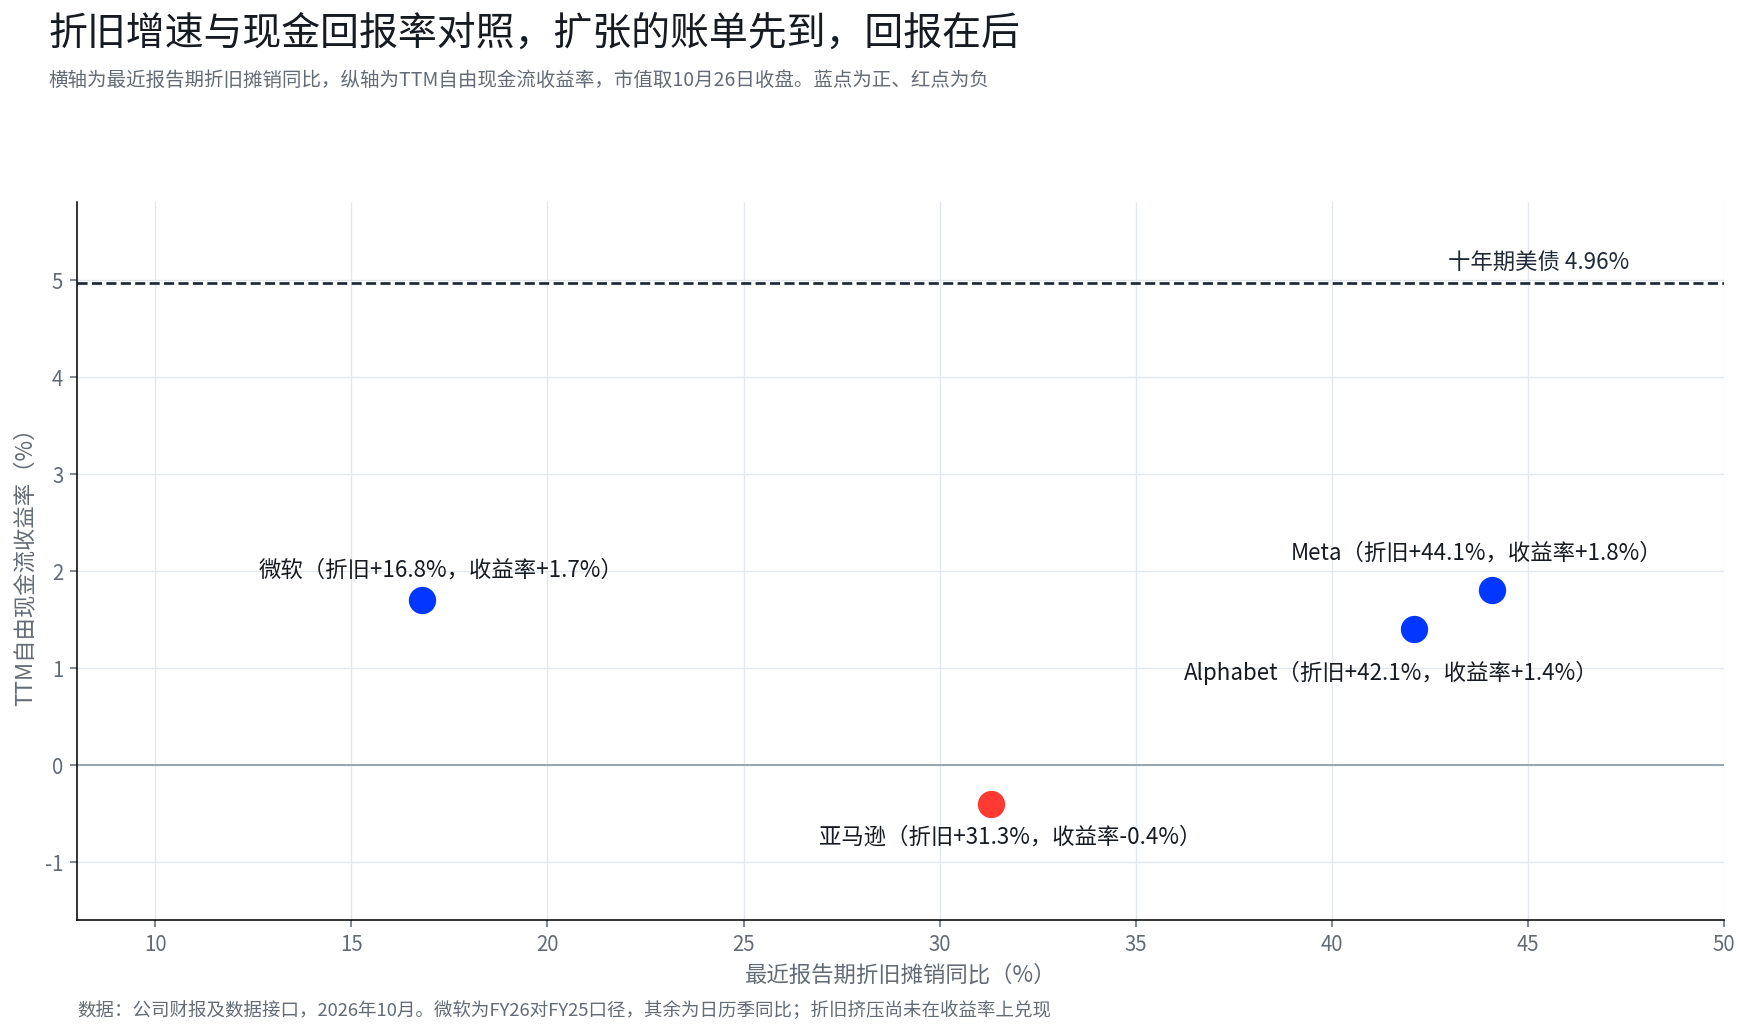
Chart: The horizontal axis is year-over-year depreciation and amortization in the most recent reporting period, and the vertical axis is trailing four-quarter free cash flow yield. The dashed line is the 4.96% 10-year US Treasury yield. Meta has the highest depreciation growth and also the highest yield, indicating that depreciation pressure has not yet been reflected in cash returns. Microsoft has the lowest depreciation growth and a positive yield, while Amazon is the only one with a negative yield.
3. Three monetization models: renting computing power, self-use transformation, and scale expansion
All three need computing power. The real difference lies in how computing power enters the revenue and profit statements.
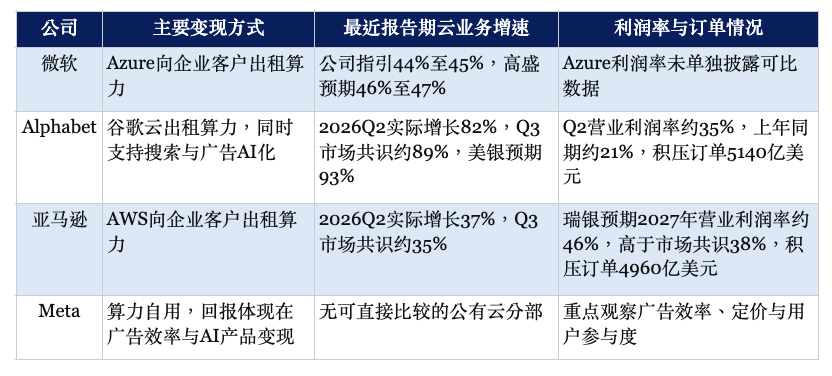
Table: Comparison of the four companies' monetization paths. Institutional expectations are cited from media reports and represent only the judgments of the relevant institutions. The companies have different business scopes, so cloud business growth rates and margins should not be directly compared horizontally.
Microsoft's and Amazon's commercial paths are relatively direct: first build data centers and computing capacity, then provide cloud services to enterprise customers, generating revenue through contracts and actual usage. The speed of return depends on capacity utilization, customer demand, pricing power, and equipment costs.
Alphabet's calculation is more complex. Google Cloud can directly rent out computing power, but AI infrastructure also serves the upgrade of search and advertising products. The same investment may support both cloud revenue and the core advertising business, and returns do not correspond entirely to a single segment. Therefore, the market needs to watch not only Google Cloud's growth but also whether AI investment can improve the competitiveness and monetization efficiency of the advertising business.
Meta has no comparable public cloud rental business, and its computing power is mainly used for internal products and advertising systems. The return on investment ultimately needs to be reflected through recommendation performance, advertising conversion, pricing power, and user engagement. This path is not without commercial value, but it is harder to identify from a single metric than cloud service revenue, and the verification period may also be longer.
Alphabet's and Amazon's backlogs total approximately $1.01 trillion, and the two companies' combined 2026 capital expenditure guidance is approximately $425 billion, with the former about 2.4 times the latter. Looking at order scale alone, the visibility of future revenue is considerable, but backlog does not equal cash already received, nor does it mean revenue can be recognized evenly in the short term.
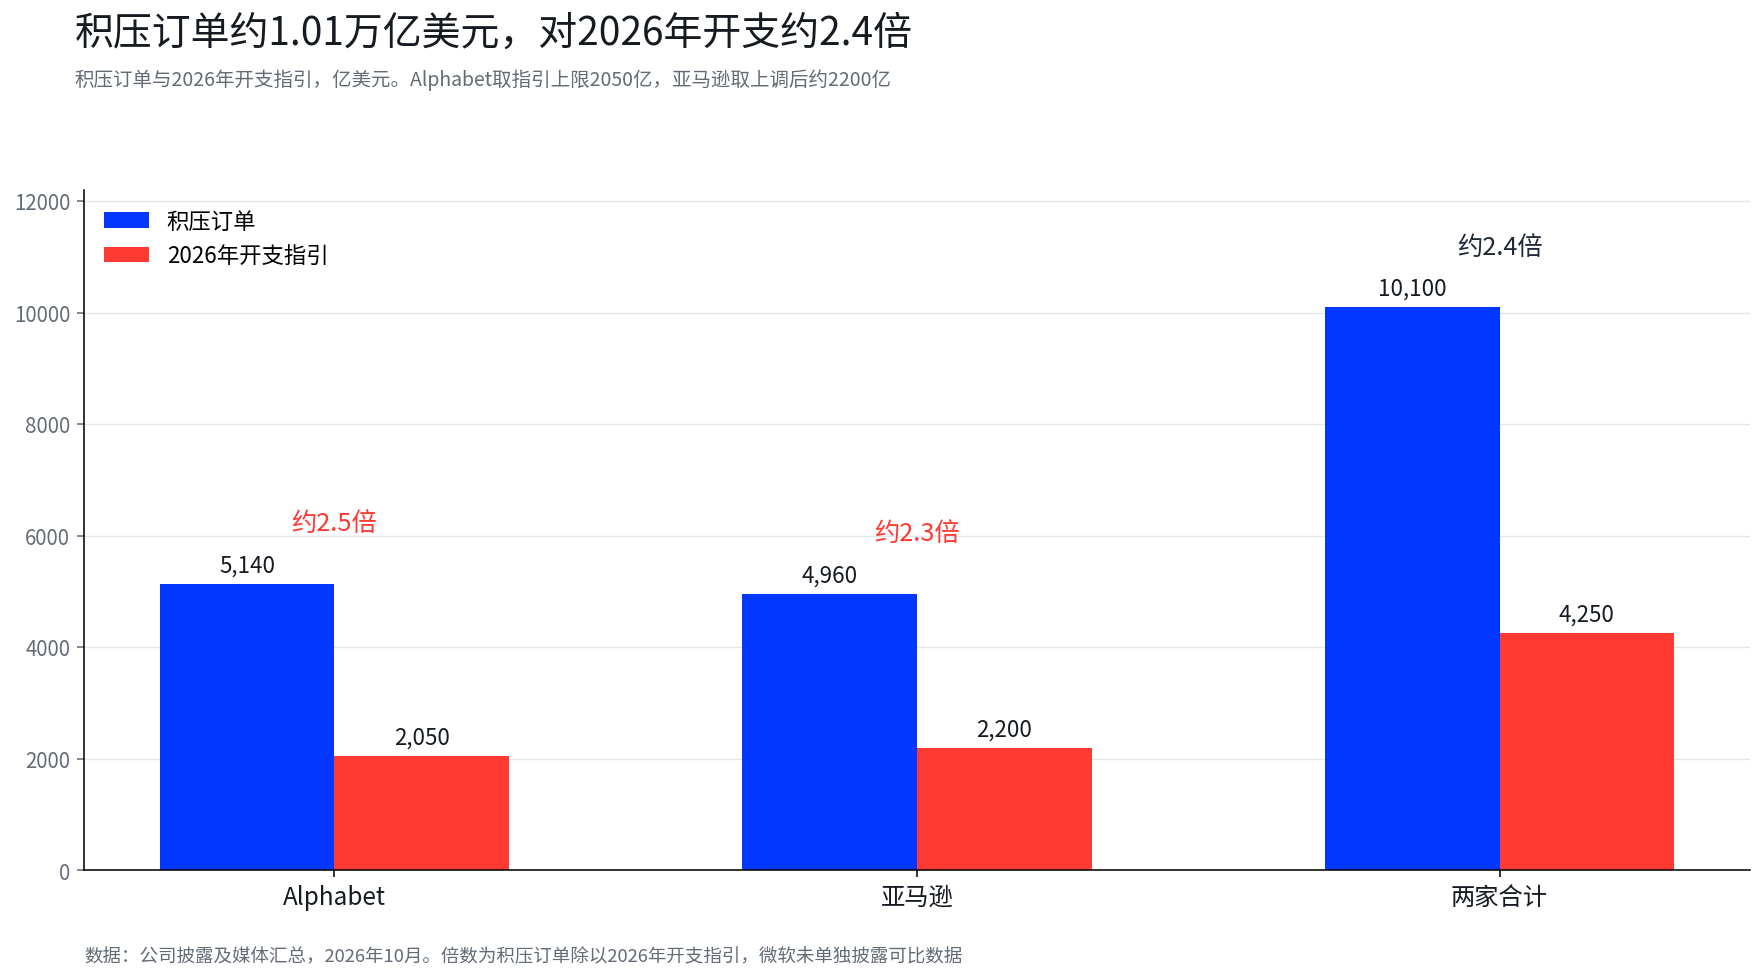
Chart: Google Cloud's $514 billion backlog is about 2.5 times Alphabet's upper spending guidance of $205 billion; AWS's $496 billion backlog is about 2.3 times Amazon's guidance of about $220 billion; the two combined are about 2.4 times. Microsoft did not separately disclose comparable data.
Whether orders can translate into shareholder returns still depends on delivery cycles, contract execution, business margins, and subsequent capital expenditures. If order growth is accompanied by margin improvement, new investment will be easier for the market to accept. If revenue grows but cannot drive margins, the scale of orders alone will not be enough to prove investment returns.
4. Microsoft: Azure growth must pass the test, and the free cash flow commitment cannot fall short
The key for Microsoft is whether cloud business growth can support continued expansion while delivering on management's free cash flow expectations.
According to media reports, Goldman Sachs expects Azure growth of 46% to 47% in constant currency, above the company's guidance of 44% to 45%. Morgan Stanley, meanwhile, views about 47% as a reference level for supporting the current valuation. Both are institutional judgments, not company commitments.
If Azure growth meets or exceeds institutional expectations, the market will have more reason to believe that new computing capacity is translating into actual demand. If the result is only at the low end of the company's guidance range, investors may further ask whether revenue growth can be maintained as capital expenditures continue to rise, and when cash flow will return to stronger growth.
The scale of investment explains why this question matters. Microsoft's fiscal 2026 capital expenditures were approximately $115.95 billion, up 80% year over year. According to Visible Alpha consensus cited by Goldman Sachs, fiscal 2027 capital expenditures are approximately $221 billion, up 52% year over year. The company's capital expenditure guidance for this quarter exceeds $50 billion, compared with about $19 billion in the same period last year.
At the same time, Microsoft has committed to keeping free cash flow positive in fiscal 2027. Whether the commitment can be delivered ultimately depends on operating cash flow growth, the actual pace of capital expenditures, and related costs; the scale of investment itself does not determine the outcome. According to media reports, Goldman Sachs expects Microsoft's fiscal 2028 free cash flow to be approximately $14.3 billion, implying that even if the company continues to expand, the improvement in cash returns may still experience volatility.
Calendar-year and fiscal-year labels also need to be viewed separately. Microsoft's calendar 2026 capital expenditure guidance was reportedly adjusted from about $190 billion to about $175 billion. Morningstar analysis suggests this is mainly related to the accounting treatment of lease reclassification, and the actual construction plan was not reduced accordingly, so it should not be simply interpreted as the company actively slowing AI investment.
Microsoft's relative advantage is that it still has positive free cash flow, and its depreciation and amortization growth in the most recent reporting period was about 16.8% year over year, lower than the others. Goldman Sachs also expects Microsoft to add about 5GW of new online computing capacity in fiscal 2027, with total computing capacity potentially reaching about 40GW by mid-2030. Its in-house Maia 300 chip is expected to lower inference costs. All of the above are institutional views or forecasts.
This earnings report requires judging three pieces of information together: whether Azure growth meets expectations, whether capital expenditure guidance is revised upward again, and how management explains the path to delivering free cash flow. A single impressive cloud business growth rate alone is not enough to answer all the questions.
5. Alphabet: Can the $514 billion backlog translate into higher profits?
Alphabet does not lack demand. The difficulty is making cloud business growth and margin improvement keep pace with infrastructure investment.
According to Visible Alpha data, market expectations for Alphabet's third-quarter revenue were raised from $121.4 billion in April to about $127.9 billion, with advertising business resilience being one of the supports. In the cloud business, Bank of America expects third-quarter revenue growth of 93%, above the market consensus of about 89%, mainly based on new capacity deployment and growth in TPU external sales. All of the above are institutional expectations cited by media.
Profit margin is another important indicator. In the second quarter of 2026, Google Cloud's operating profit was approximately $8.8 billion, with an operating margin of about 35%, compared with about 21% in the same period last year. This improvement shows that cloud business growth has begun to translate into operating profit, but whether it can continue will depend on the revenue and cost structure after new capacity is put into use.
Alphabet has raised its 2026 capital expenditure guidance to $195 billion to