Panic capitulation, but no fresh capital in sight: $62K becomes the mid-term dividing line for Bitcoin's fate


- Core View: Bitcoin's crash to $62K triggered capitulation-style selling, with realized losses reaching levels seen at historic bottoms. Leveraged longs have largely been liquidated, but broad demand remains absent. The $62K–$66K range has become the key defense line determining the market's direction going forward.
- Key Elements:
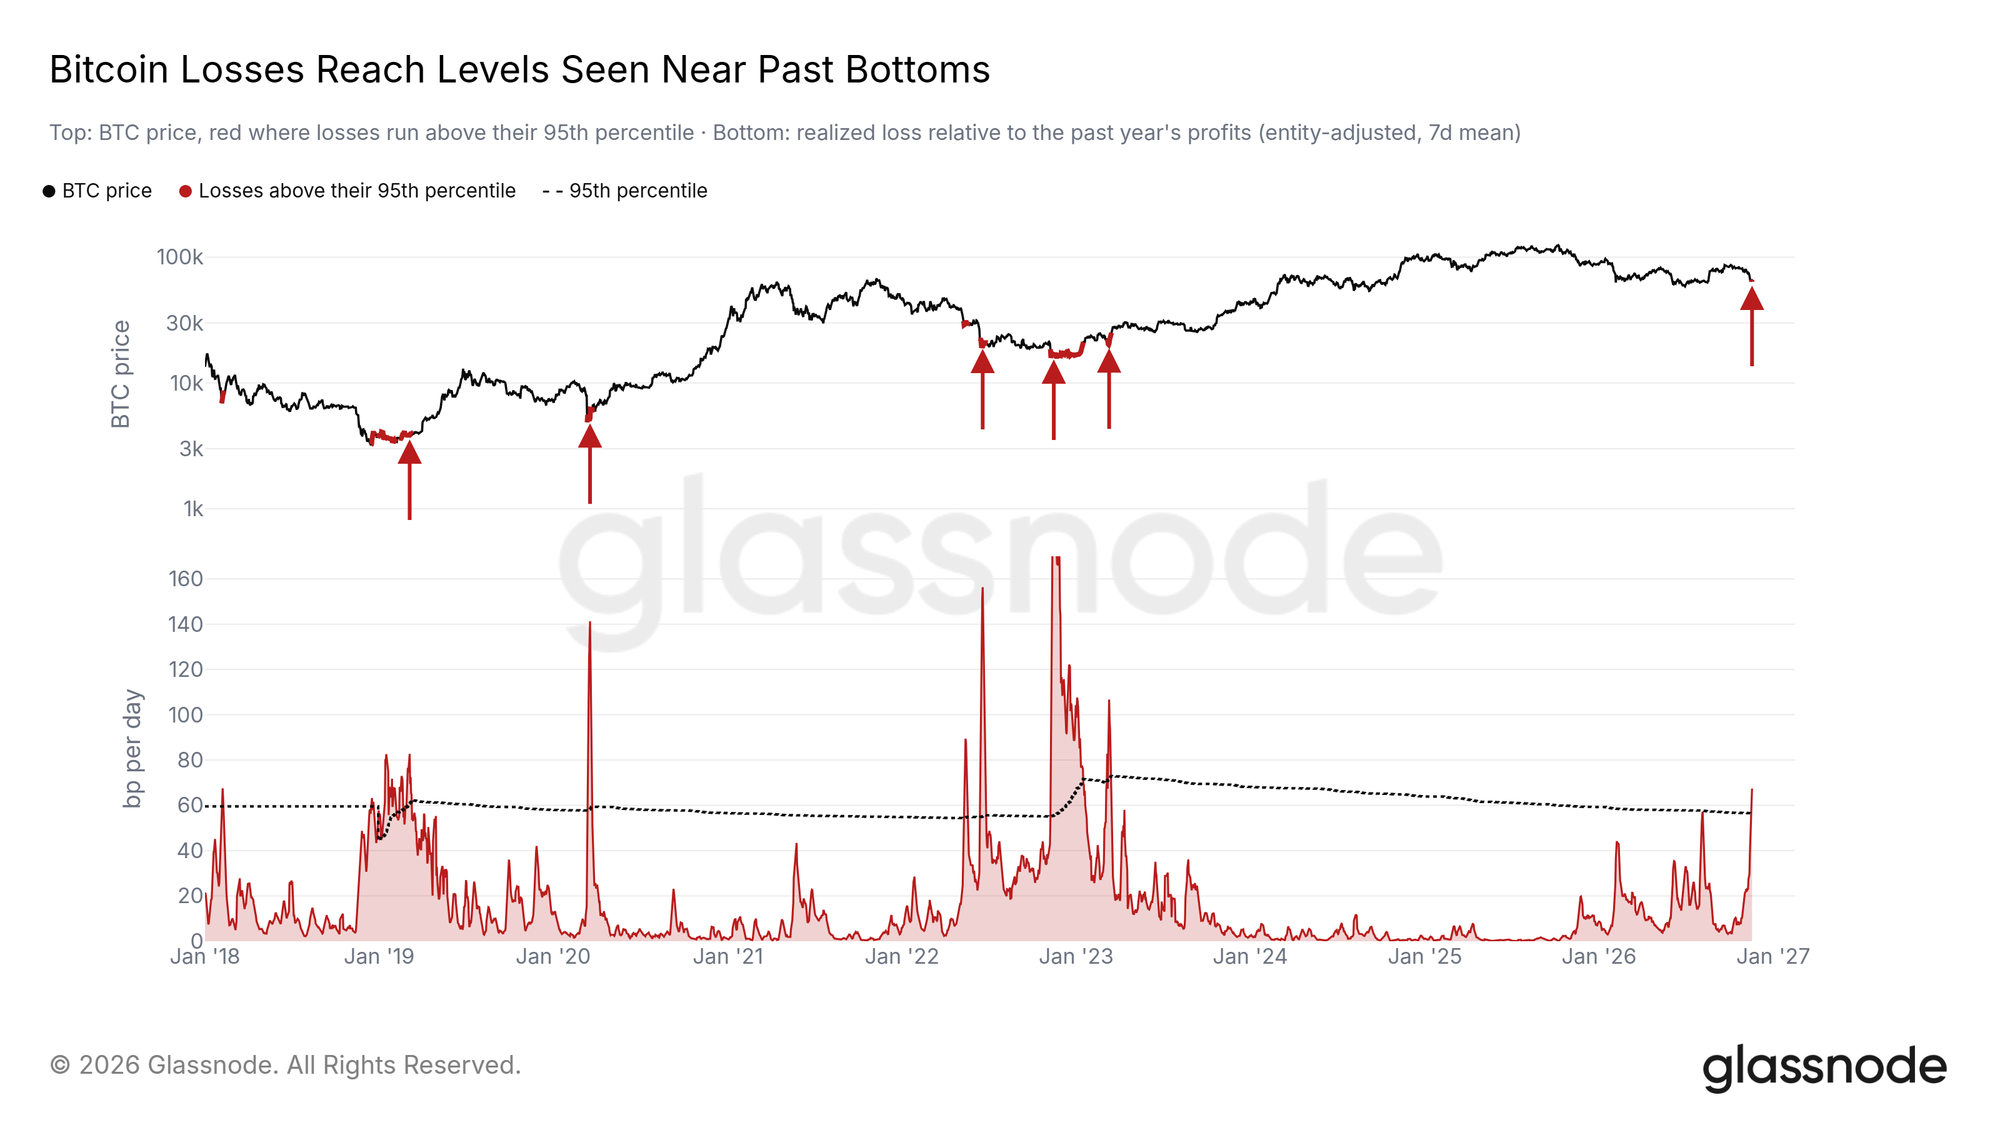
- Realized losses surged to levels only seen at market bottoms in 2018, 2020, 2022, and early 2023—reappearing for the first time in recent years, signaling that recent buyers have thrown in the towel and exited.
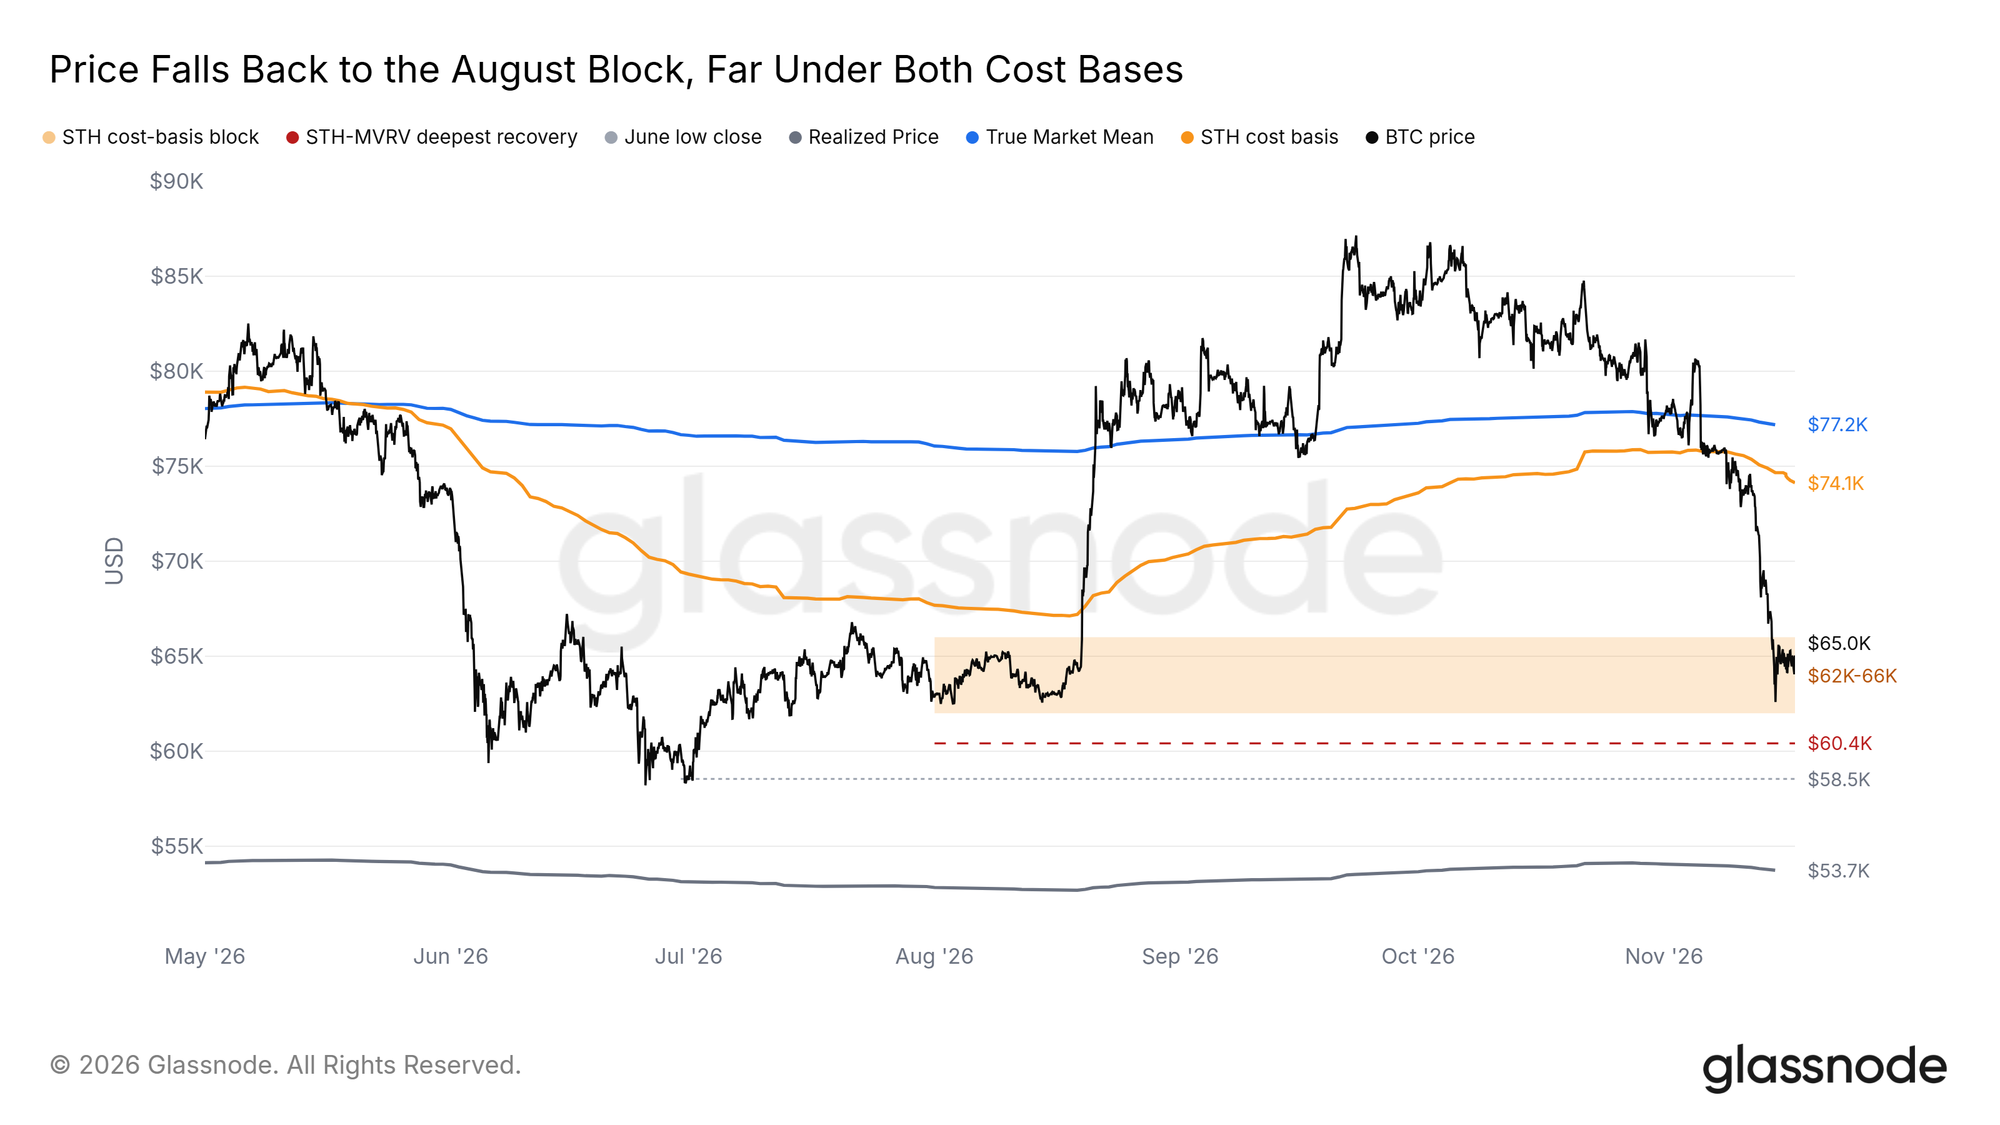
- The $62K–$66K range holds about one-fifth of all coins in circulation, with roughly 66,000 BTC added over the two-day crash, making it the only dense support below; a break would open the path to $58.5K and even $53.7K.
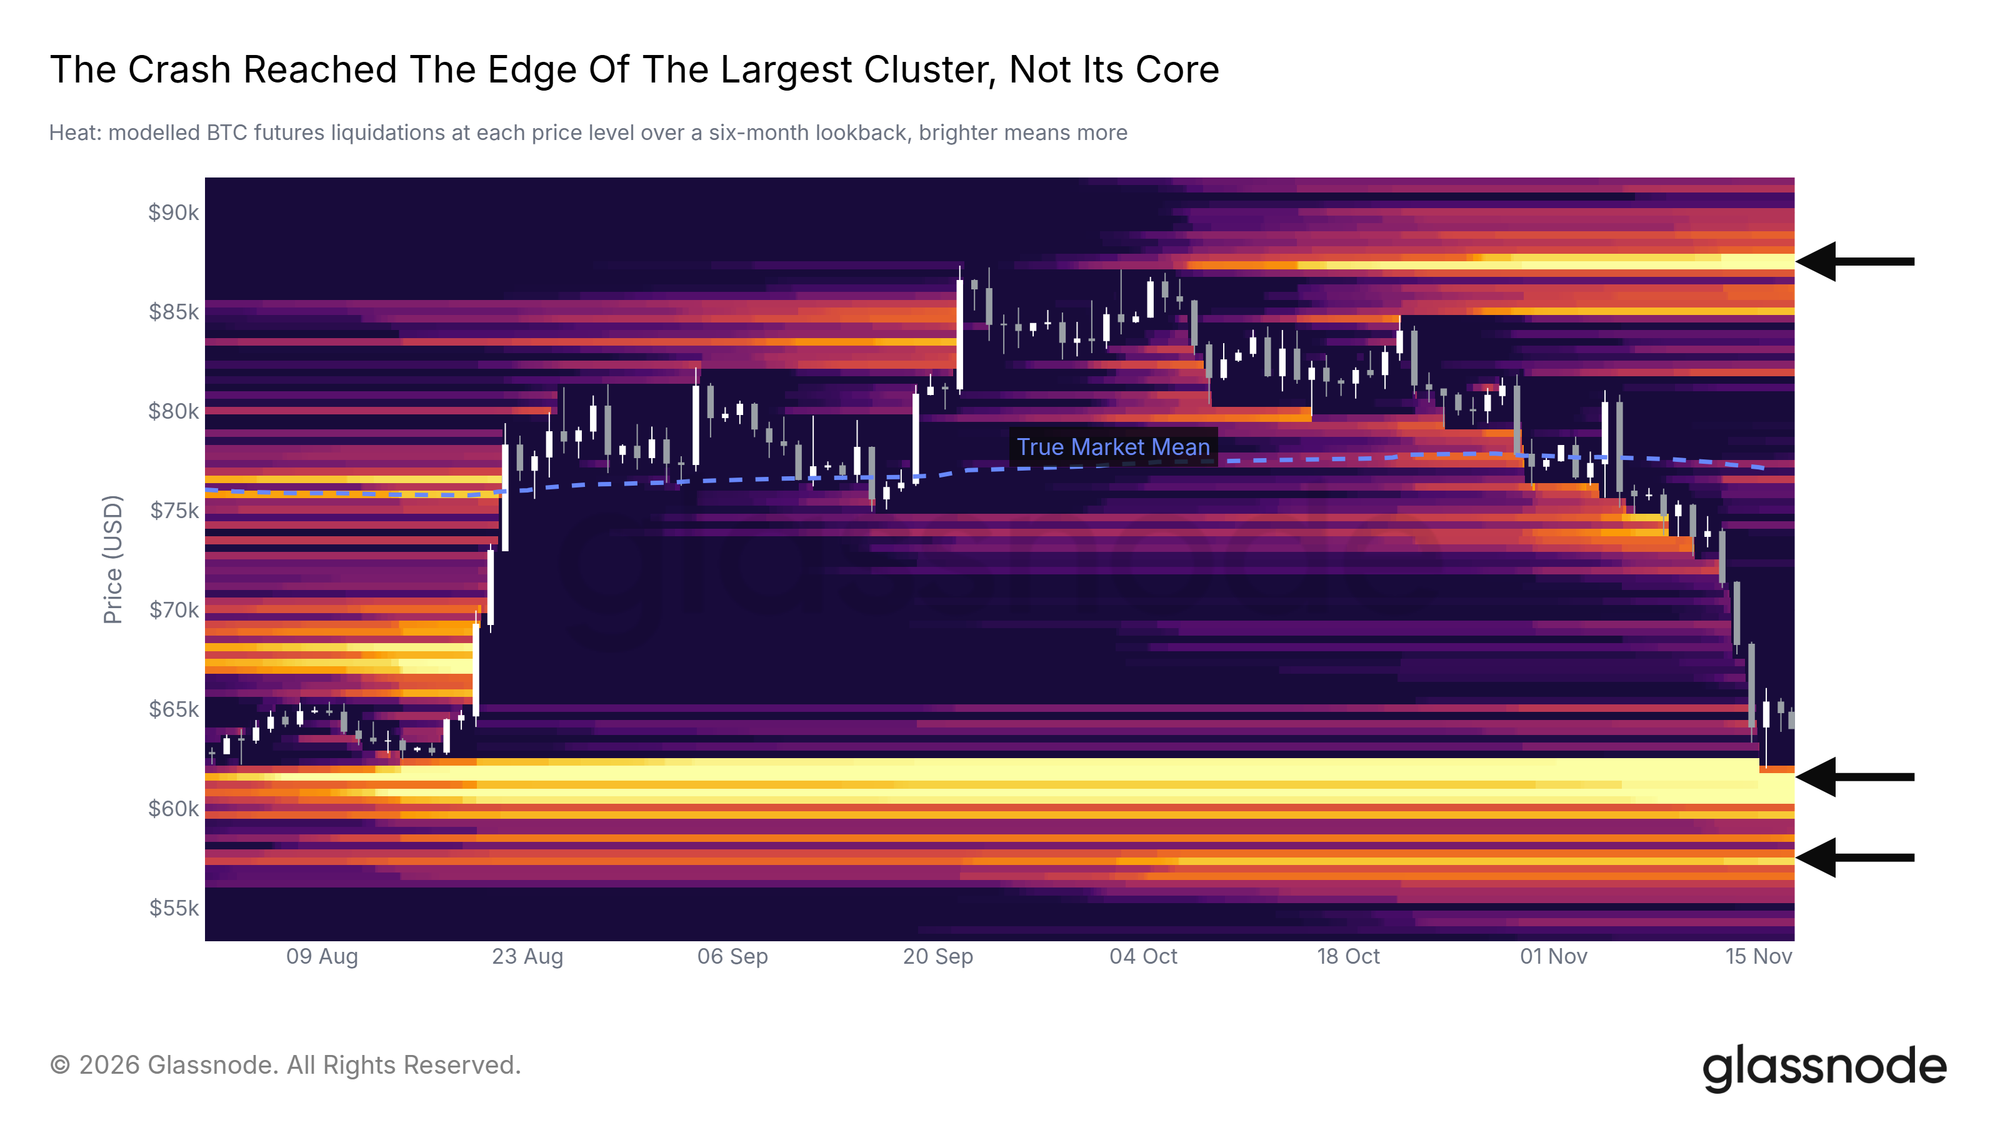
- November 13–14 saw the largest long liquidation event since 2023, with most forced selling pressure above $62K already released; remaining position clusters sit in the $59.5K–$62.2K range.
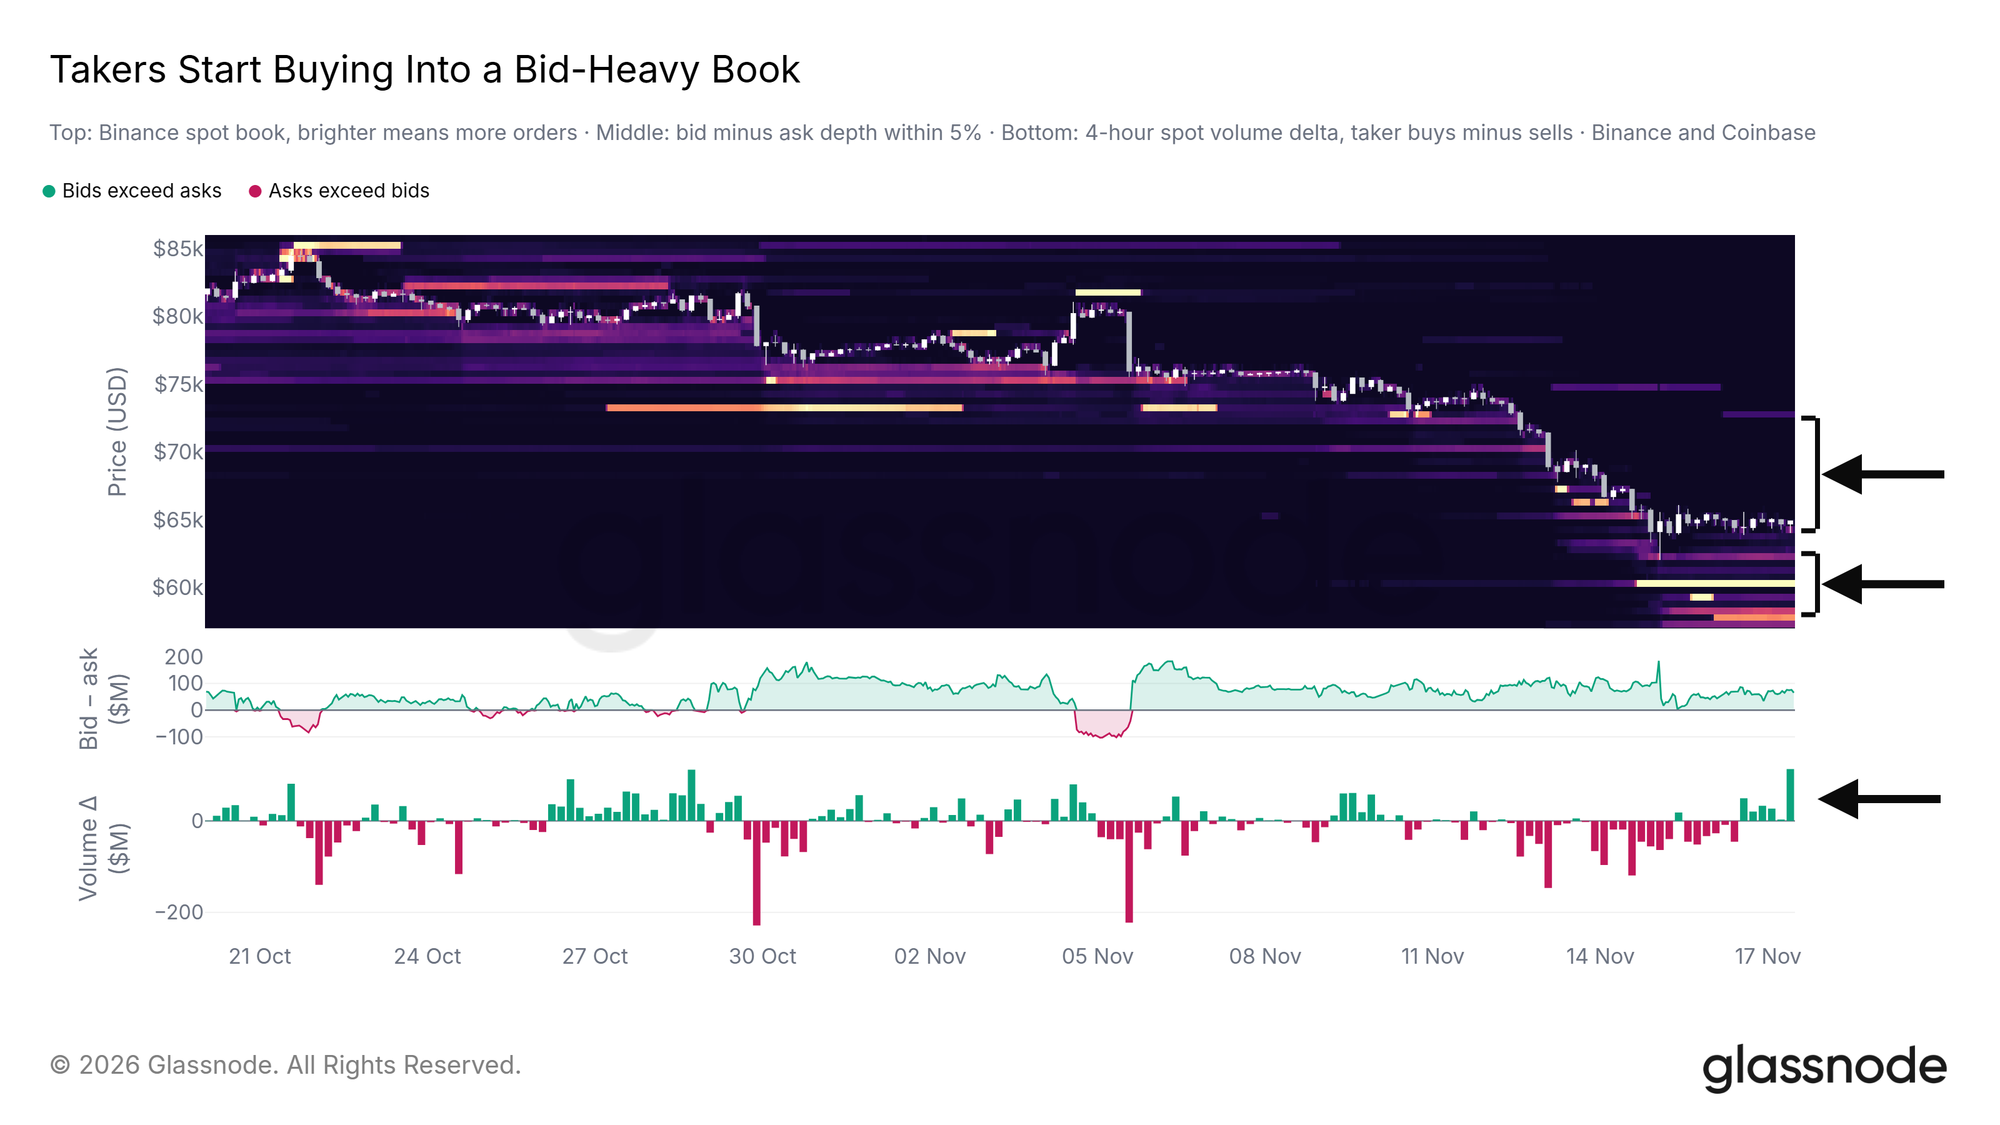
- Bid orders on Binance and Coinbase are about 2.3 times ask orders, with the largest single bid wall since August near $60K; the Coinbase premium turned positive on the evening of November 15 before falling back again.
- Stablecoin supply shrank 4.2% over 90 days, correlated with rising short-term Treasury yields; MARA and Riot sold a combined ~28,000 BTC this month to pivot toward AI data centers; U.S. spot ETFs saw $2.6 billion in net outflows over ten days.
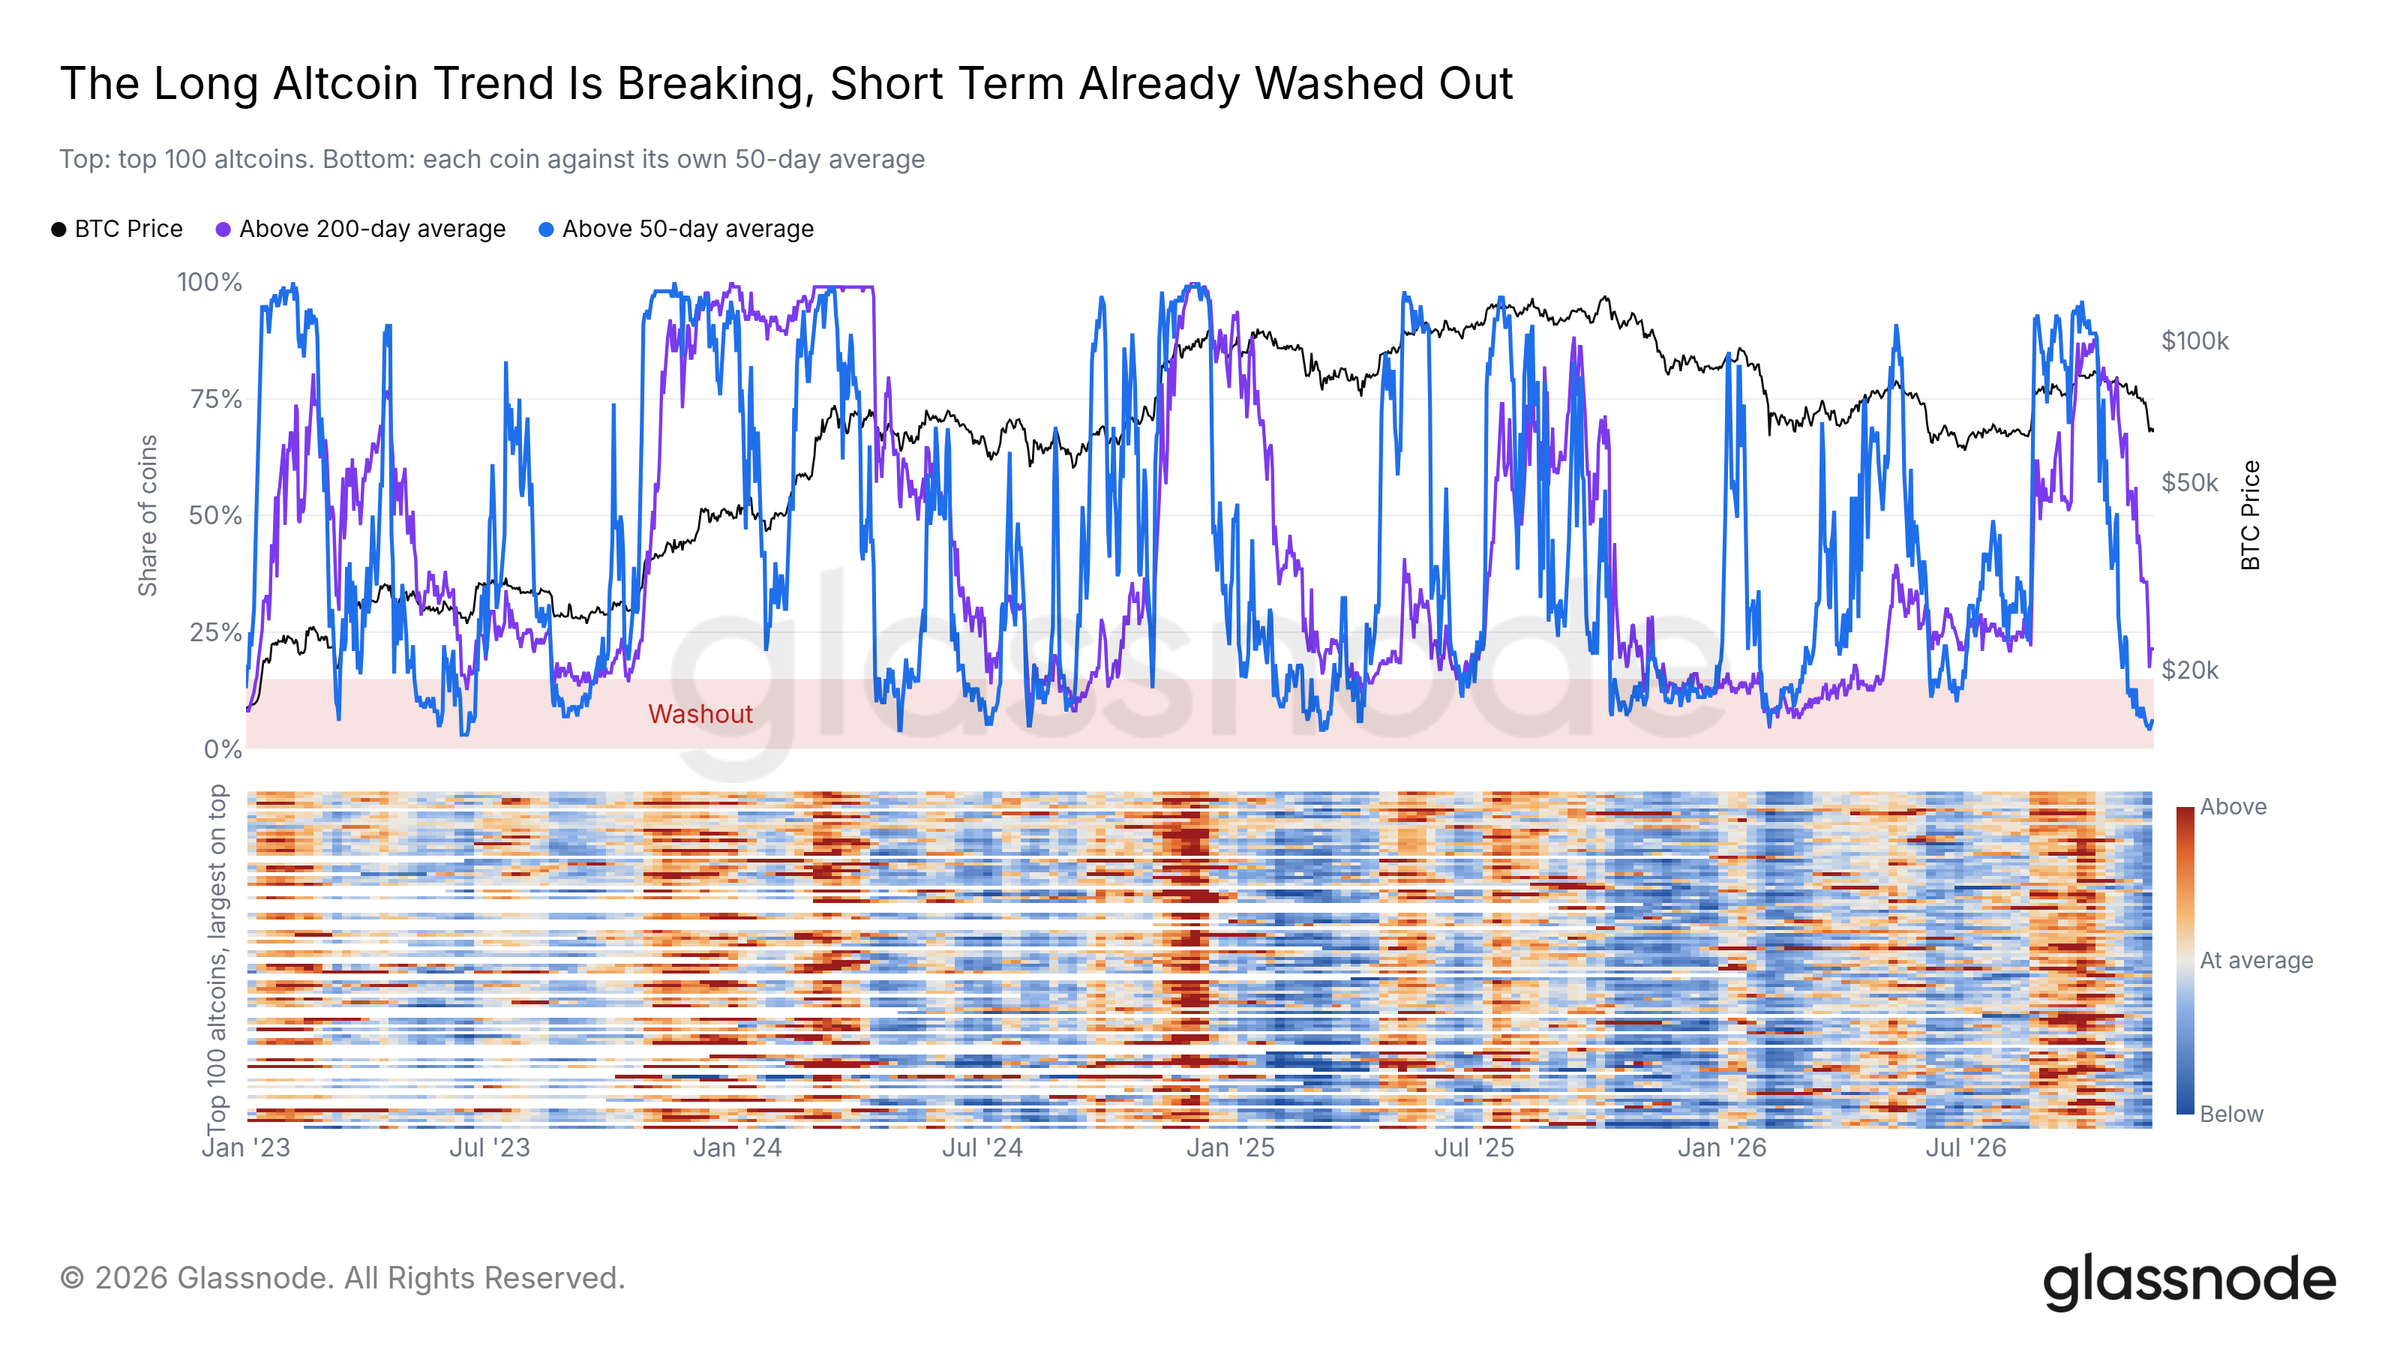
- Only 6% of the top 100 altcoins by market cap are above their 50-day moving average, and the share above the 200-day moving average fell from over one-third to 21% within a week—shakeout depth approaching characteristics of historic local bottoms.
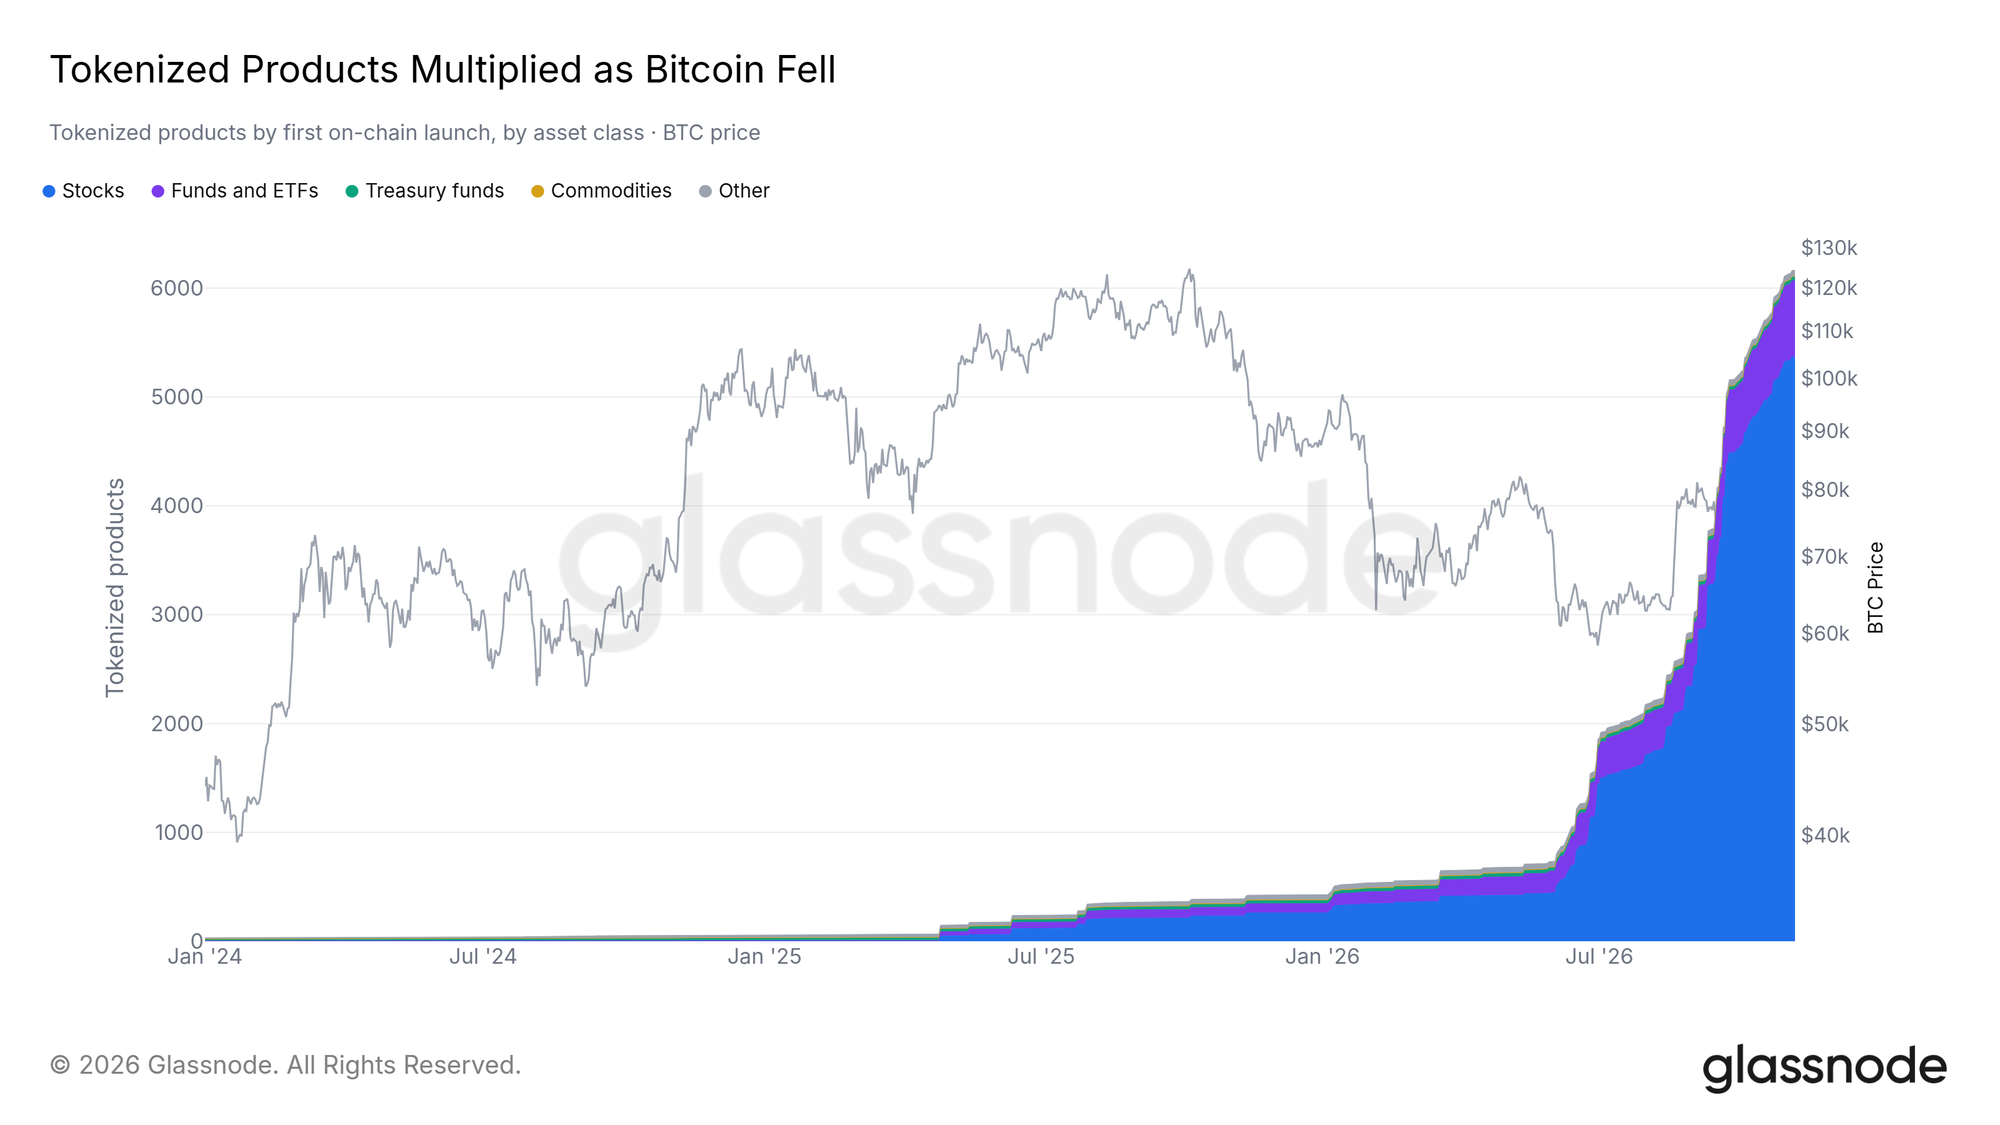
- Tokenized products grew from 428 at the start of the year to roughly 6,200, with the increase mainly from tokenized stocks—a contrast to Bitcoin's 15% decline over the same period.
Original author: Glassnode
Original translation: Chopper, Foresight News
Capitulation Begins
On November 15, Bitcoin's price plunged to $62,000, with investors selling at losses of a magnitude never seen before. To enable cross-year comparison, the chart below compares realized losses (losses locked in when coins change hands below their purchase price) with realized profits cashed out over the past year.
This metric has reached levels that have only appeared near past market bottoms, such as in 2018, 2020, 2022, and early 2023—and this is the first time it has reappeared since then. Spikes in this kind of indicator typically signal investor capitulation: those who bought at highs throw in the towel and sell their coins to those willing to take over.
Recent Buyers Realize Losses
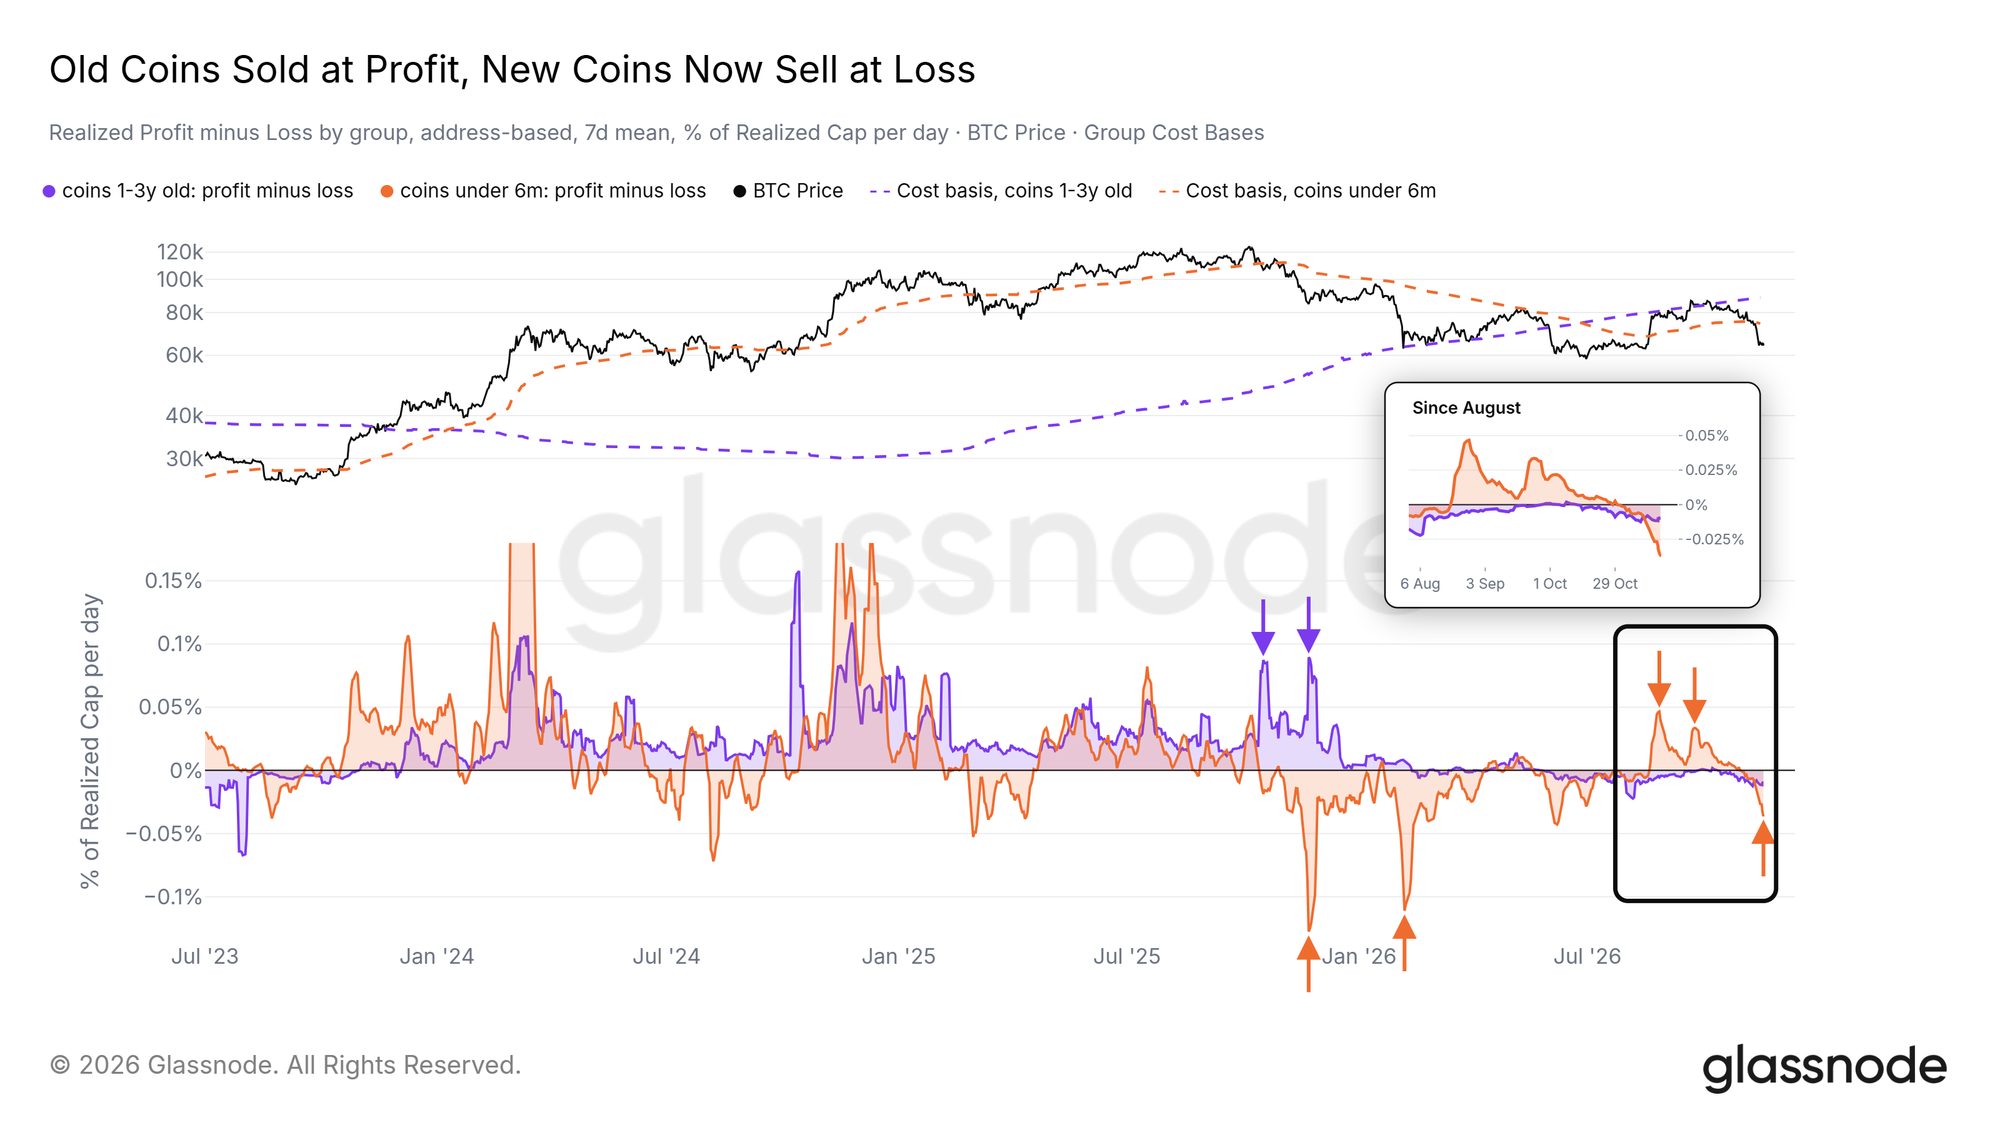
The selling pressure comes from recent buyers. Bitcoin held for 1 to 3 years realized its last batch of large profits in late 2025 and has been quiet since. Bitcoin held for less than 6 months suffered major losses in early 2026, took profits during the September and October rallies, and is now selling at a loss again.
Price is currently below the average purchase cost of both of these groups (the dashed line in the chart). As long as price stays below this line, more recent buyers may choose to sell at a loss rather than continue waiting.
Holding the August Dense Zone
Last week we flagged the $62,000–$66,000 range as the only dense support zone below price, and this crash has fallen right into it. The short-term holder cost basis distribution chart shows where recent buyers bought in. This zone, formed around the August low, contains roughly one-fifth of all Bitcoin holder supply, and it gained about 66,000 BTC during the two heaviest days of selling pressure, indicating that buyers were stepping in.
This makes it a level that must be held, and the risk below it is significant. Short-term holders bought very few coins below $62,000, and the largest cluster of long liquidations on the liquidation chart sits right beneath it. If the daily candle closes below this range, all August buyers turn to losses while leveraged longs are forced out, and a single breakdown could turn into a rapid plunge. The next level down is the June low of $58,500.
To the upside, the short-term holder cost basis sits at $74,100—the level where recent buyers as a whole would break even.
Leverage Has Been Flushed
This crash wiped out leveraged longs on a massive scale. Measured on an open interest basis, November 13 and 14 saw the largest batches of long liquidations since 2023. The liquidation heatmap simulates the prices at which leveraged futures positions would be forcibly closed, and it shows that most longs above $62,000 are already gone. Last week, the gap between the market price and the liquidation price down to $60,000 looked small, and the crash punched straight through that gap in one move.
That position cluster remains below price, located at $59,500–$62,200. If price returns here, there could be one final round of flushing, though most of the forced selling pressure above $62,000 has already been released. The largest cluster of short positions sits far above, near $87,500.
Bids Waiting Below
Within 5% above and below price, resting buy orders on Binance and Coinbase are currently about 2.3 times the size of sell orders. Since late August, bids have typically only slightly exceeded asks. The brightest area on the heatmap is near $60,000—Binance's largest single bid wall since August.
During the crash, aggressive sell orders kept hitting these bids, as shown by the red bars in the chart. Over the past day, they have turned to net buying. Resting orders can be pulled at any time, so these bids only truly matter once they are filled.
Premium at the Market Low
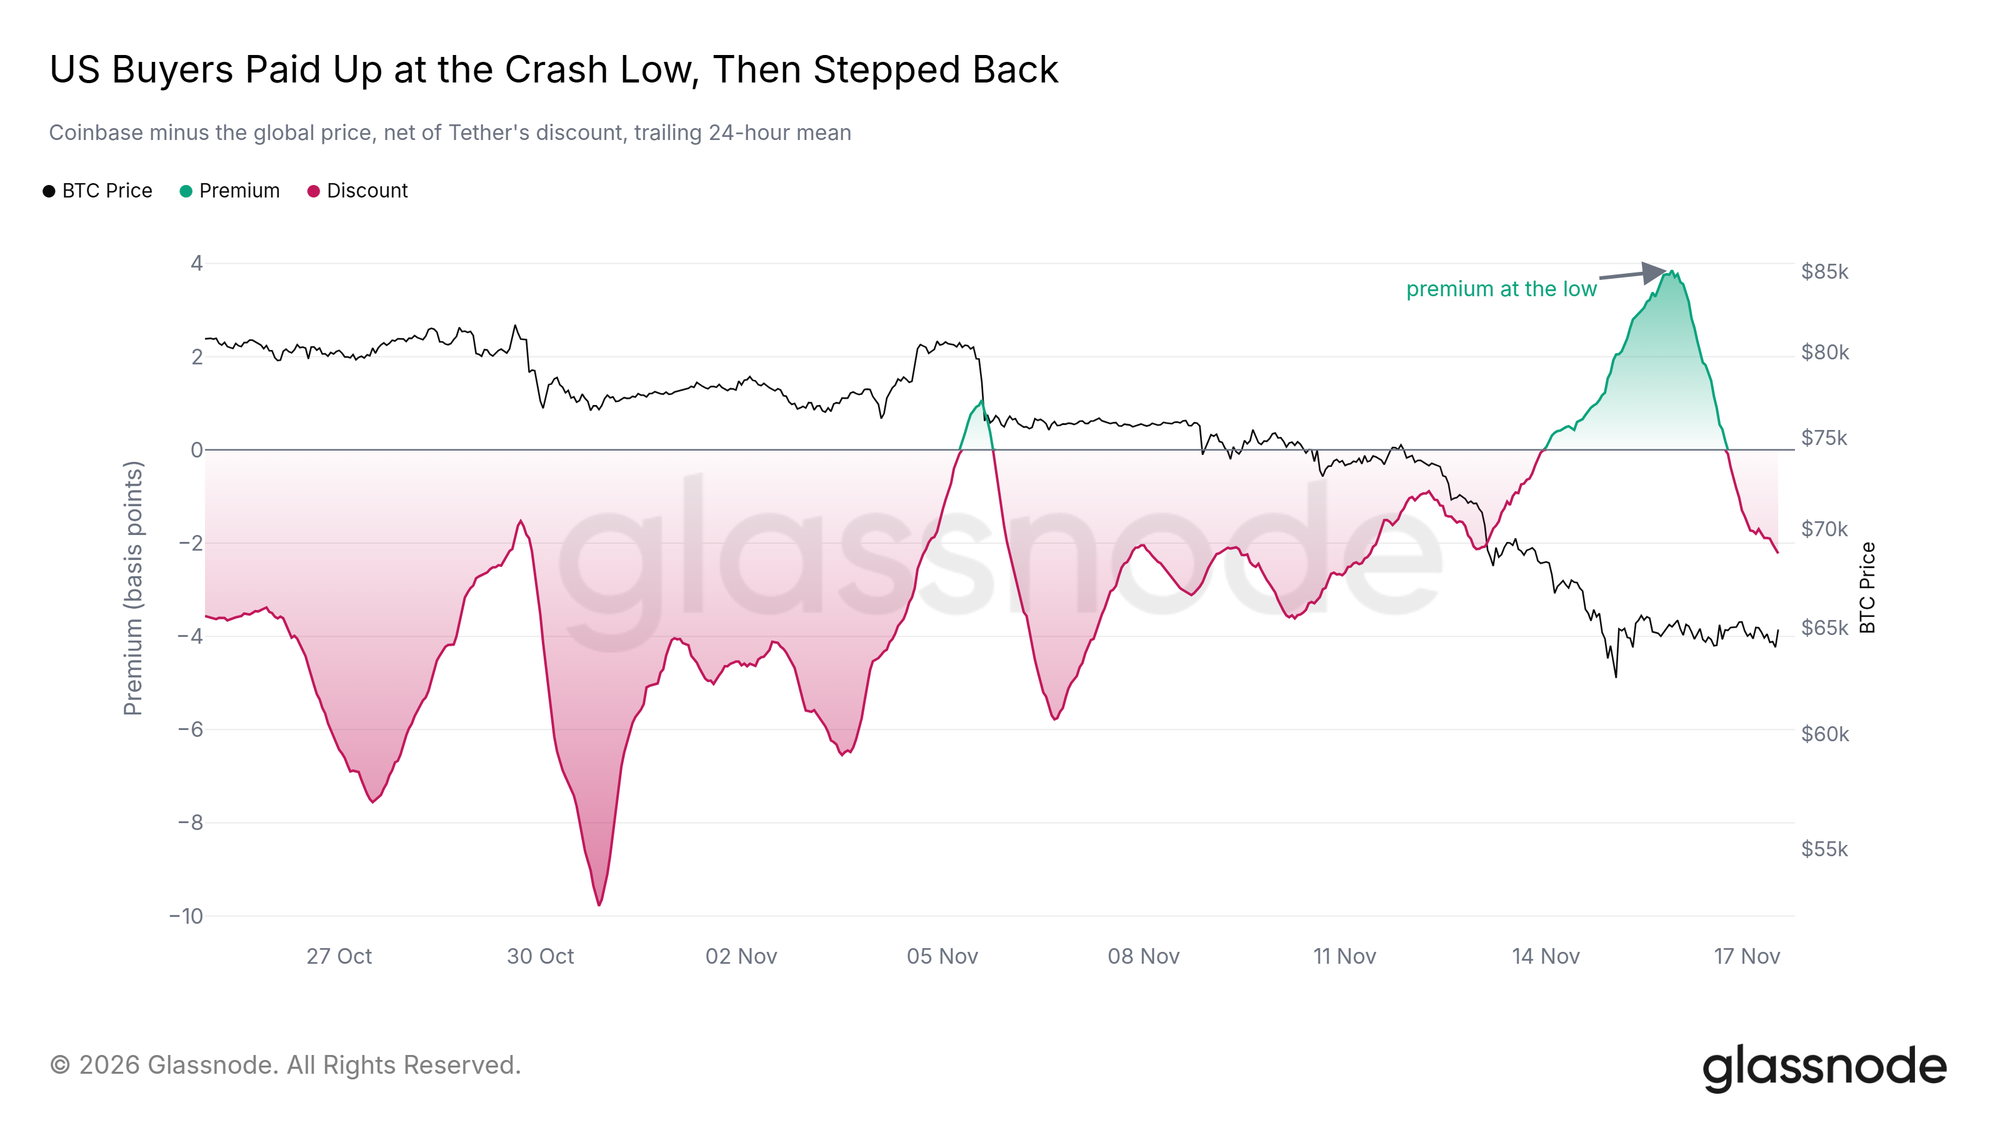
The Coinbase Premium metric compares Bitcoin's price on Coinbase with the global price. Since late October, it has been negative almost every hour. On the weekend when the bottom formed, it turned to a positive premium as US buyers bid prices up, peaking on the evening of November 15.
Since then it has slipped back to a slight discount. If the premium turns positive again and holds, it would signal that US demand has genuinely returned.
Cash Flowing to Short-Term Treasuries
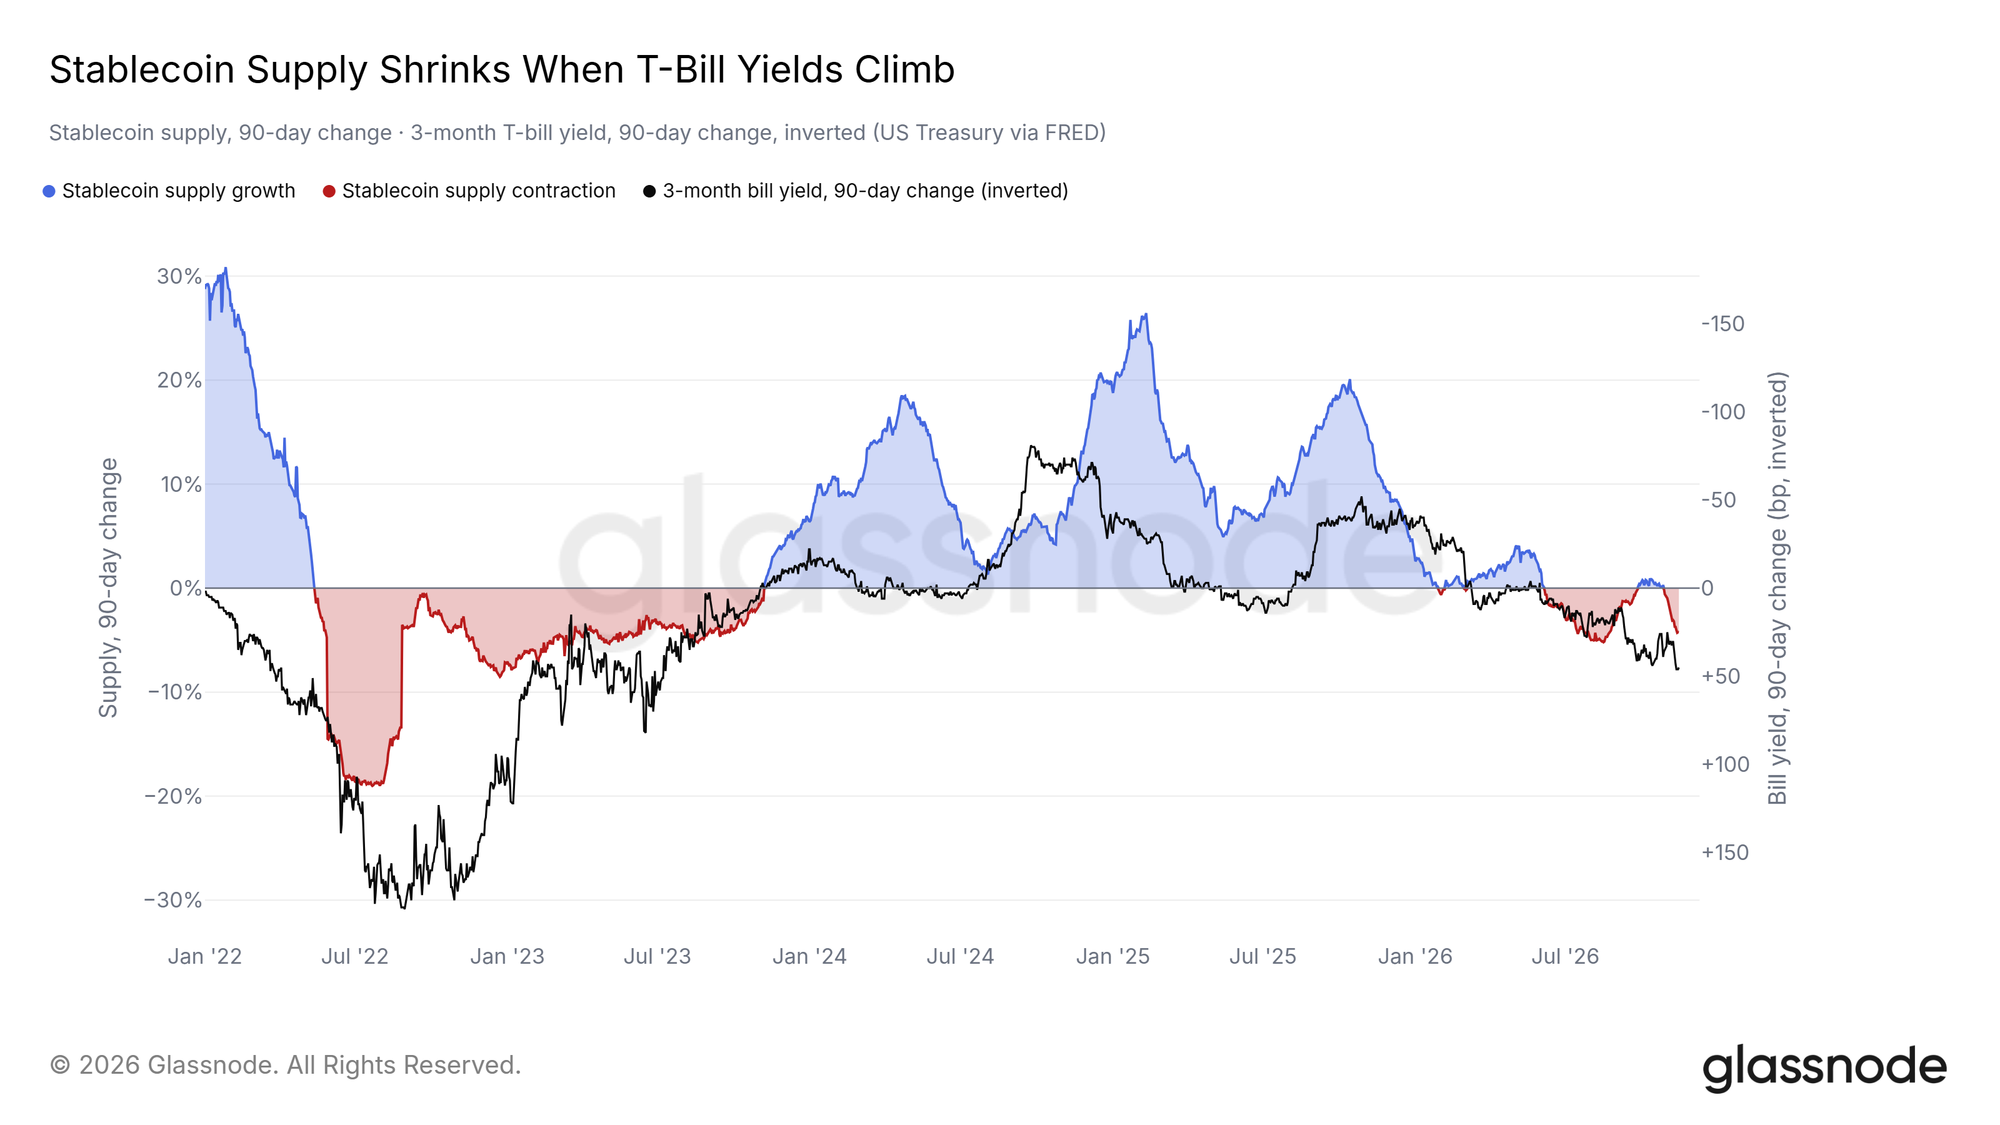
Beyond the dip-buying at the low, demand overall remains thin. Stablecoin supply in the crypto market has shrunk 4.2% over the past 90 days.
Since 2022, stablecoin supply has tended to contract when short-term Treasury yields rise. Stablecoins pay holders no interest, while issuers earn the yield on the underlying Treasuries; once yields rise, holders swap stablecoins for short-term Treasuries or money market funds. The 3-month Treasury bill yield has risen about 45 basis points over 90 days, and stablecoin supply has turned down accordingly. In 2022, when Treasury yields rose fastest, stablecoin supply shrank by nearly one-fifth within 3 months. If Treasury yields stop rising, this drain on crypto cash will likely ease.
Miners Selling Coins to Fund AI
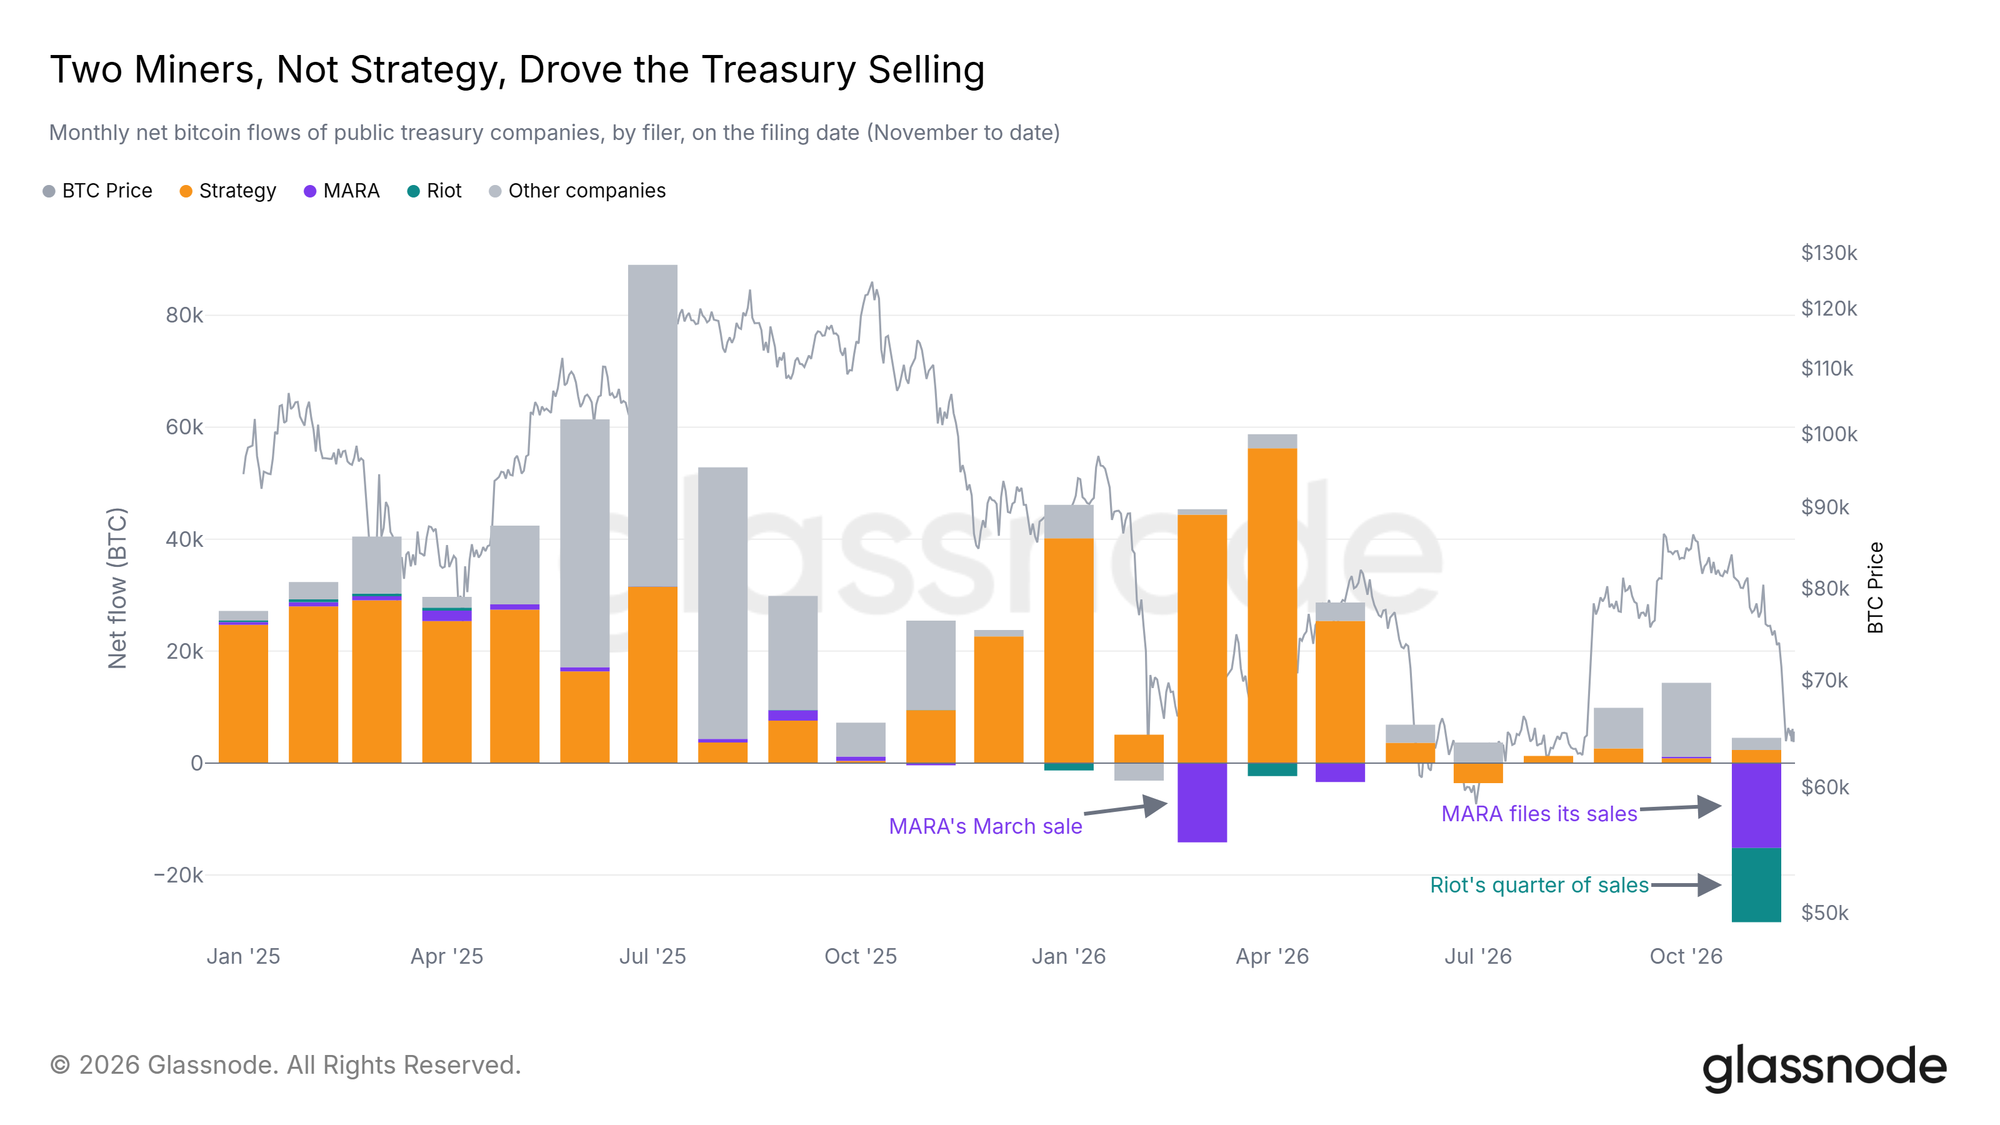
Miners are selling too. MARA and Riot reported combined sales of about 28,000 BTC this month, while Strategy continued buying. Both miners are pivoting to AI and high-performance computing data centers, selling coins to fund this transition. Apart from these two, Bitcoin treasury companies were net buyers in November.
US spot ETFs show the same lack of demand, with $2.6 billion in net outflows over the ten trading days through November 13.
Upcoming Events
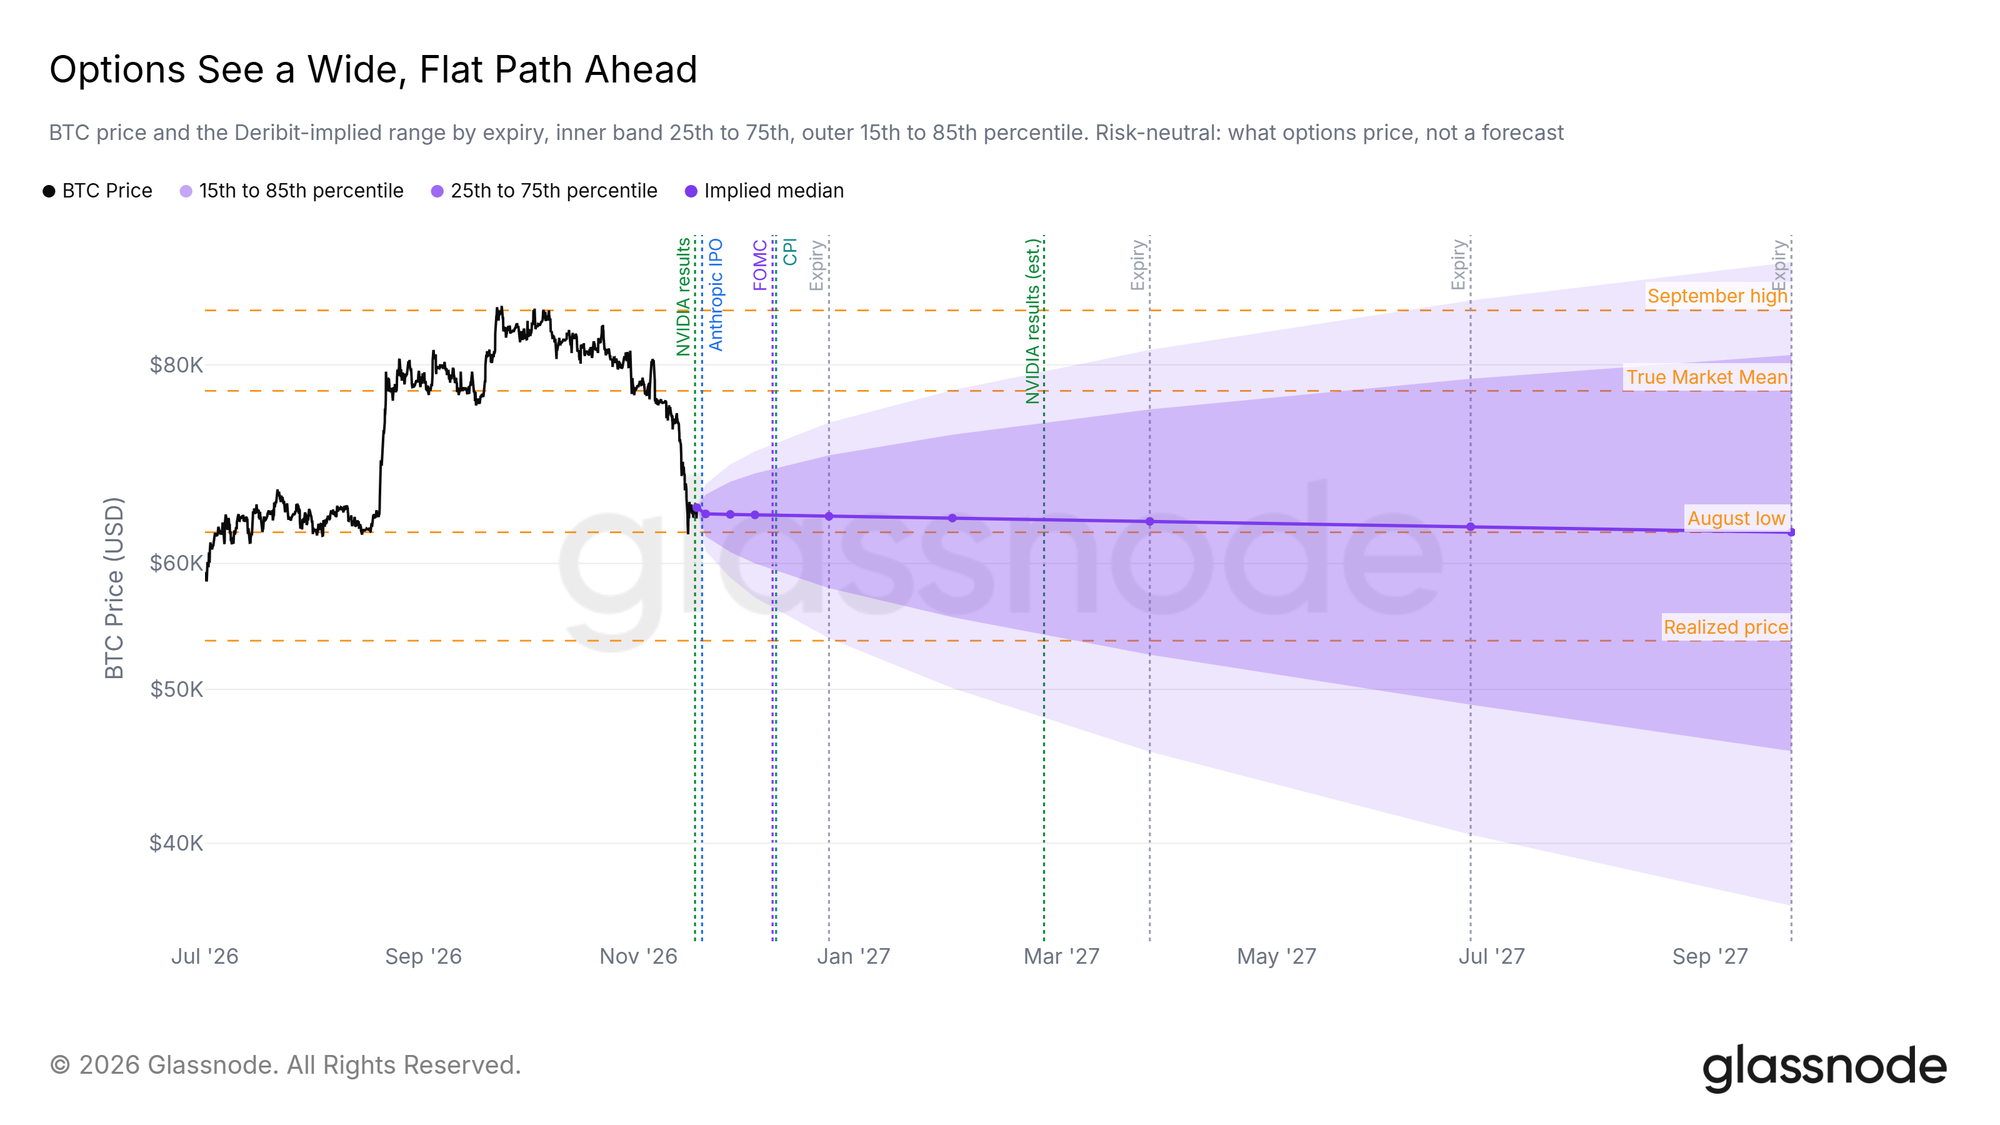
Options reflect how much uncertainty the market is pricing. The implied price range from Deribit options extends all the way to 2027, with the midpoint of the range close to today's price. For contracts expiring in September 2027, options are pricing roughly a one-third probability that Bitcoin settles below the realized price of $53,700, and about a 20% probability that it settles above the September high.
Several events over the coming weeks could influence this price range. Anthropic is expected to begin trading on Nasdaq on November 19; the Federal Reserve meets on December 9, with November CPI released the following day.
A Familiar Altcoin Shakeout
Among the top 100 altcoins by market cap, only 6% are trading above their 50-day moving average, deeply mired in shakeout territory. The share above the 200-day moving average fell from over one-third to 21% within a week.
Since 2023, the deepest shakeout each year has occurred within four days of a Bitcoin local low, and each time Bitcoin's price rose 60 days later. But the longer trend is still breaking down: the share above the 200-day moving average has yet to reach prior lows. If the summer low ultimately proves to be the cycle low, these precedents suggest the altcoin selloff is nearing its end.
Crypto Continues to Grow
Bitcoin is struggling to attract new capital, but the rest of crypto is still advancing. The number of tokenized products bringing stocks, funds, and other real-world assets on-chain grew from 428 at the start of the year to about 6,200 by early November. Over the same period, Bitcoin fell 15%. The growth came mainly from tokenized stocks, with trading migrating onto crypto exchanges as well.
Conclusion
Bitcoin has been through a shakeout, with realized losses reaching capitulation levels and leverage emptied out. At the low, the August dense zone absorbed selling pressure, aggressive sell orders turned to buying, and US buyers paid a premium on Coinbase. But broad demand is still absent—stablecoins are contracting, miners are selling, and capital is flowing out of ETFs.
The $62,000–$66,000 range is the line to watch next. Reclaiming the $74,100 short-term holder cost basis would confirm that a bottom is forming. Conversely, a daily close below $62,000 would turn all August buyers into losses, and with few buyers below and dense long liquidations, it would open the way toward the June low of $58,500 and the realized price of $53,700.