QQQ Reclaims Its 200-Day Moving Average: Ahead of the December Rate Hike, Who Should We Watch in This AI Rally?


- Core View: QQQ reclaiming its 200-day moving average only signifies that the index's technical repair is complete; within the AI sector, pricing has already entered a phase of divergence. Capital is shifting from "buying AI" to "buying execution," and whether an individual stock can pass the exam depends on whether the pace of earnings realization can outpace valuation pressure.
- Key Elements:
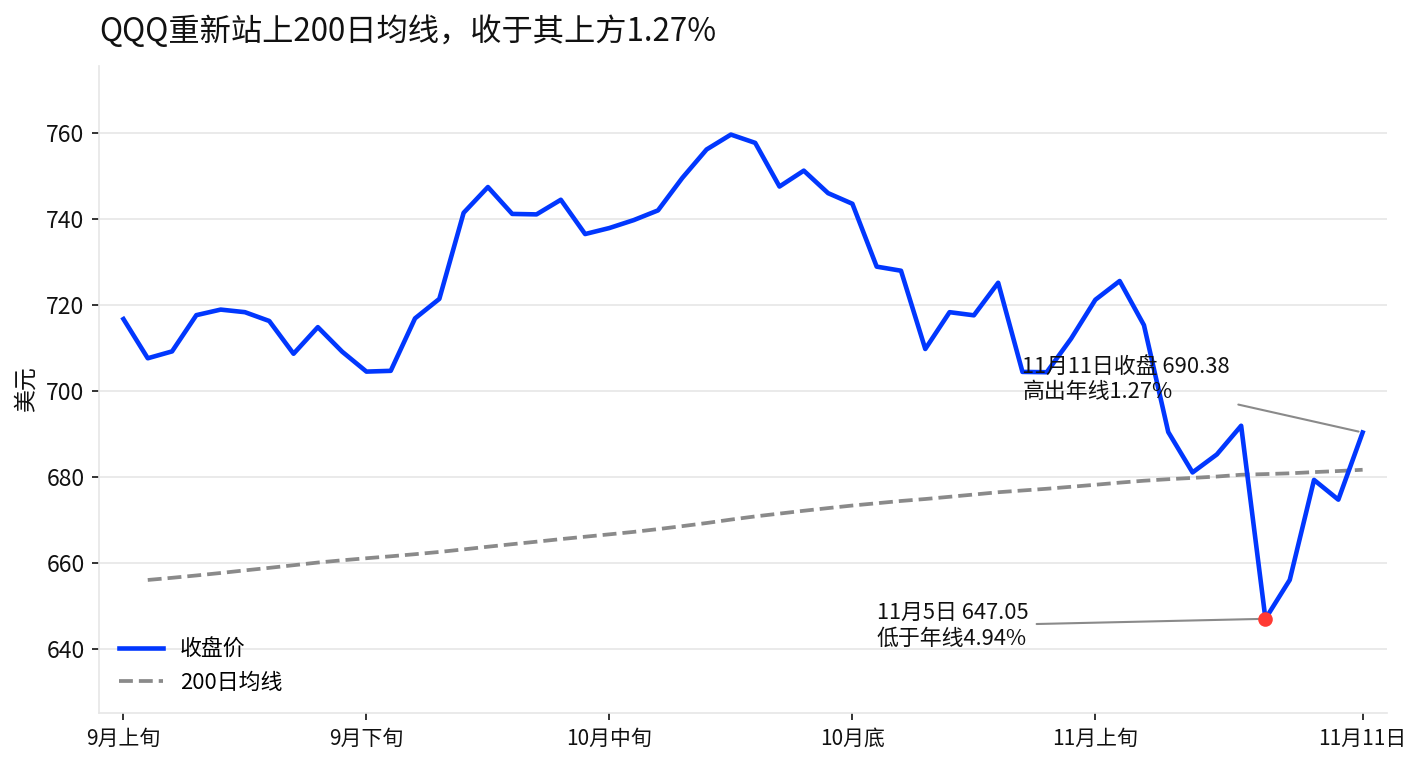
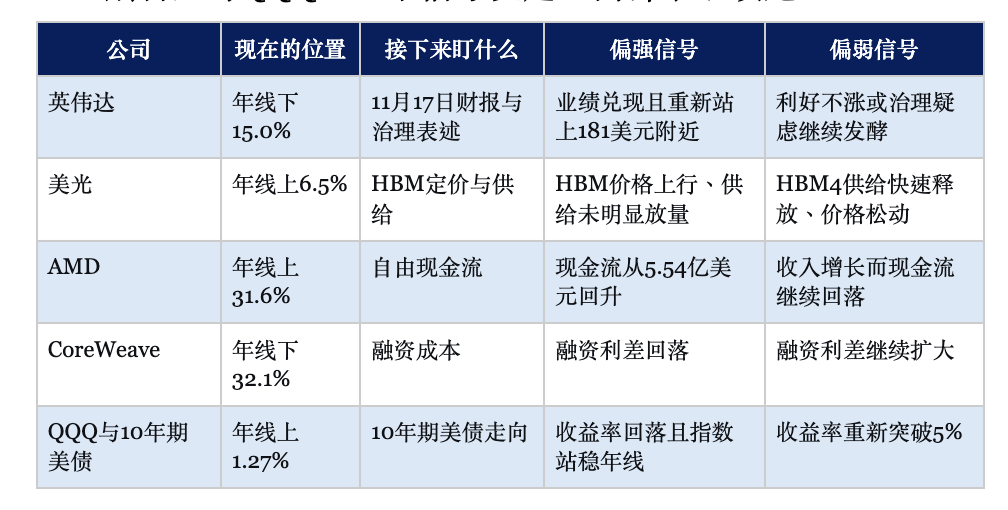
- QQQ closed at $690.38 on November 11, 1.27% above its 200-day moving average, but heavyweight Nvidia remains 15% below its 200-day line, down 28.6% from its 52-week high.
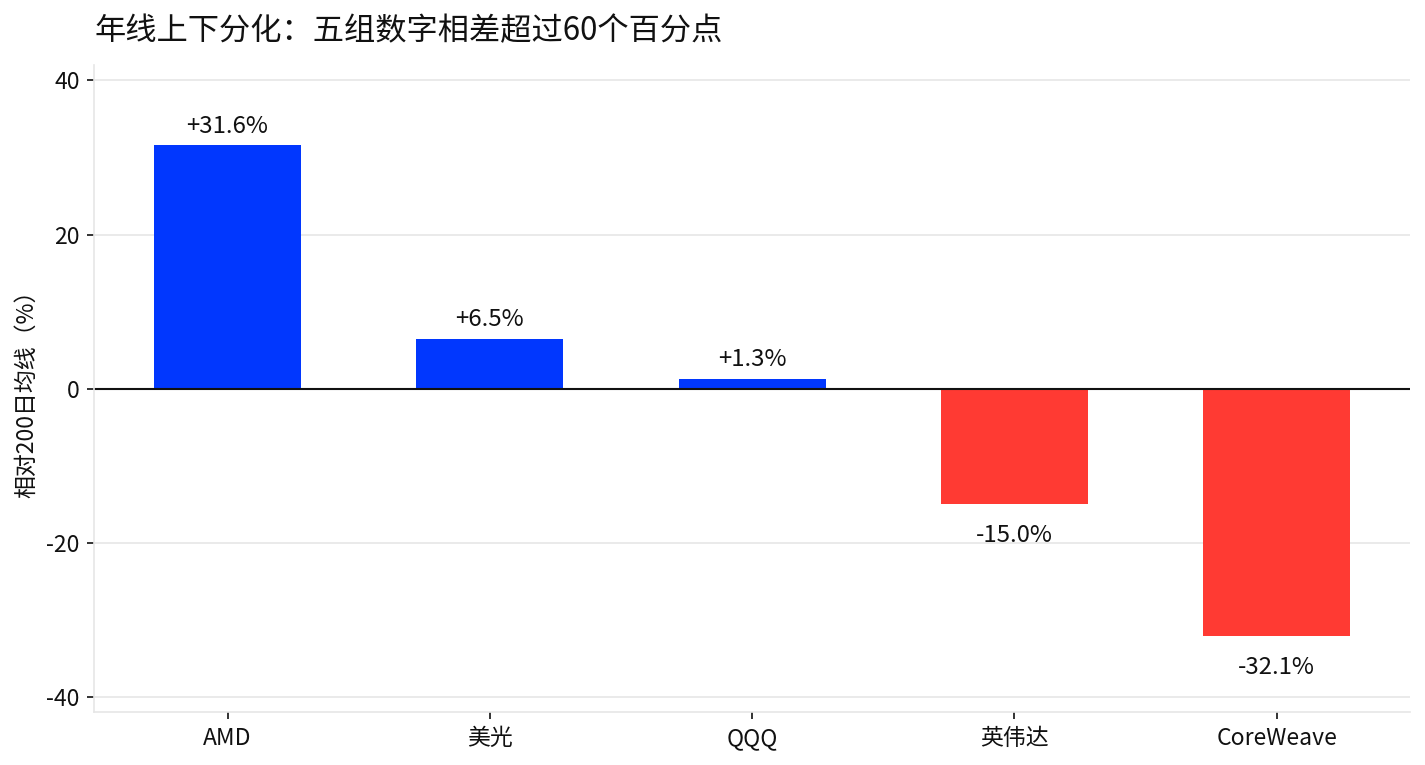
- The AI trade is clearly diverging: AMD is 31.6% above its 200-day line (high expectations already priced in), Micron is 6.5% above (fundamentals being realized), and CoreWeave is 32.1% below (financing risks unresolved).
- Nvidia's November 17 earnings report must address both performance and governance concerns; the market consensus expects revenue of approximately $108.8 billion, up roughly 90% year-over-year.
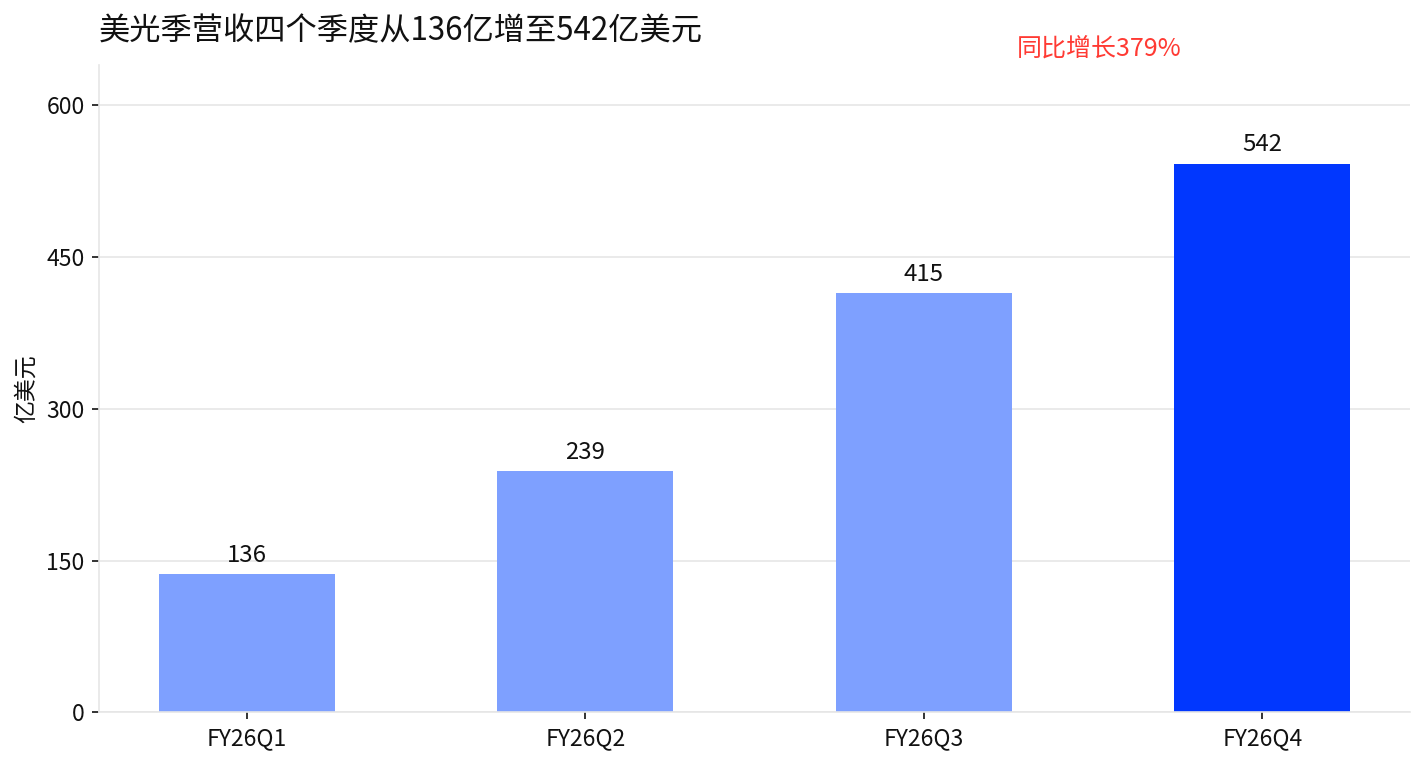
- Micron's fiscal 2026 fourth-quarter revenue grew 379% year-over-year, with a price-to-earnings ratio of about 10.8x, but the meaning of this low valuation depends on HBM pricing and the pace of HBM4 supply release.
- The roughly 87% probability of a 25-basis-point rate hike in December has already been priced in by the market in advance; the 10-year U.S. Treasury yield at 4.998%, hovering near the 5% threshold, is the real master switch for discounting high-valuation long-duration cash flows.
QQQ has reclaimed its 200-day moving average, but the real AI rally has only just entered a phase of divergence. The index has completed its repair, and individual stocks are now being tested. Under the same AI theme, the market's answers have already become completely different: some are back above the 200-day line and still generating cash flow, while others have risen 25% yet remain 30% below the 200-day line. This article unfolds along a single thread: after the index-level repair is complete, who can pass this test depends on whether the speed of earnings delivery can outrun valuation pressure.
1. QQQ Reclaims the 200-Day Line in Four Days, but the Real Pressure Still Lies Above It
On November 5, QQQ closed at $647.05, 4.94% below its 200-day moving average at the time. On November 6 and November 9, it recovered most of the gap over two days, dipped slightly on November 10, and closed at $690.38 on November 11, 1.27% above the 200-day line.
In similar historical patterns, outcomes after reclaiming the 200-day line have varied widely. This statistic reflects only historical cases and cannot indicate which path is more likely going forward, so it is not elaborated here. What truly matters is clearing the two hurdles immediately ahead.
The first hurdle is Nvidia. This QQQ rebound was ignited by memory, optical communications, and CoreWeave. Nvidia, the largest weight, rose 2.87% on November 11 to close at $173.73, still 15% below its 200-day line. It reports earnings after market close on November 17. If governance concerns cannot be clarified before then, the index's structure above the 200-day line will lack an important confirmation.
The second hurdle is interest rates. The 10-year US Treasury yield closed at 4.998% on November 10, hugging the 5% threshold. Long-end rates determine how high-valuation, long-duration cash flows are discounted—a more fundamental variable than index levels.
2. The Index Is Back, but AI Has Already Split into Three Tiers
Plotting the position of five key names relative to their 200-day moving averages on a single chart reveals three distinct states.
- AMD closed at $552.90, 31.6% above its 200-day line—high expectations are already priced in.
- Micron closed at $811.30, 6.5% above its 200-day line—fundamentals are delivering, with an 11.89% single-day gain on November 11.
- QQQ itself is 1.27% above its 200-day line—the index has just completed its repair.
- Nvidia is 15.0% below its 200-day line—the core weight has yet to confirm, with a 28.6% drawdown from its 52-week high.
- CoreWeave closed at $60.77, surging 24.71% on November 11, yet still 32.1% below its 200-day line—high volatility coexists with high financing risk.
These data points lead to an important judgment: the index returning to its 200-day line may not equal a broad-based AI rally resuming. Capital may be shifting from "buying AI" to "buying delivery." The position relative to the 200-day line is not random—it is the market's score for growth quality. The question going forward is not "will AI rise," but whose delivery speed can outrun valuation pressure.
3. Nvidia's Next Hurdle: Earnings Delivery and Board Investigation Uncertainty
Nvidia closed at $173.73 on November 11, up 2.87%. Over a longer horizon, it has pulled back 28.6% from its 52-week high of $243.37 and closed below its 200-day line for multiple consecutive days in early November.
According to multiple media reports in early November, discussions at the board level regarding management arrangements are gaining traction, though the company has not officially confirmed. Earnings expectations themselves are not low. According to analyst estimates cited by media, the market consensus for third-quarter revenue is around $108.8 billion, representing roughly 90% year-over-year growth. High earnings expectations yet a stock price 15% below its 200-day line—putting these two numbers together shows that the market's concerns go beyond earnings.
The November 17 earnings report needs to answer two things simultaneously: the earnings numbers, and management's commentary on governance arrangements, next-quarter guidance, and AI capital expenditure. According to media reports, institutions including Citi cut their target prices ahead of earnings. Holding ratings while discounting valuations has been Wall Street's common stance recently.
The post-earnings observation points are therefore clear. If governance concerns are clarified and earnings are delivered, the prior pullback level around $181 cited in third-party technical analysis is the first verification point for valuation discount recovery. Conversely, if earnings beat expectations but the stock cannot reclaim the $181 area, it would indicate that governance and valuation discounts have not been repaired, and revenue numbers alone are not a sufficient condition for pricing.
4. Micron Back Above the 200-Day Line: HBM Prices Matter More Than a Low P/E
Micron's fiscal 2026 fourth-quarter revenue was $54.229 billion, versus $11.315 billion in the year-ago period, up 379% year over year. Full-year revenue was $133.188 billion, with net income of $84.969 billion. Based on full-year earnings per share of $75.38, the current stock price corresponds to a P/E ratio of approximately 10.8x.
The question is how to read this low P/E. Is the market mispricing the stock, or is it pricing in a cyclical peak in advance? Micron has pulled back 35.4% from its 52-week high of $1,255 and reclaimed 6.5% above its 200-day line on November 11. The price has given the answer of "stopping the decline," but the answer of "reversing the trend" is not in past revenue.
The answer lies in HBM prices and supply. According to third-party technical analysis, there is dense prior positioning in the $800–$900 range above $811. If next quarter's HBM pricing guidance continues to rise while HBM4 supply releases from Samsung and SK Hynix do not significantly exceed expectations, the ~10x P/E is more easily interpreted as undervaluation. If HBM4 supply increases rapidly and prices begin to soften, the low P/E is more likely to be early pricing of a cyclical peak. The same valuation datum carries two diametrically opposite meanings—the dividing line is HBM pricing.
5. CoreWeave Up 25% but Still Below Its 200-Day Line: What Rebounded Was Solvency Concerns, Not Financing Risk
CoreWeave surged 24.71% in a single day after earnings, but at $60.77 it remains 32.1% below its 200-day line, with a 56% drawdown from its 52-week high. It rose a quarter—why is it still 30% below the 200-day line? The answer is that earnings proved strong business growth but did not fully prove that financing costs have declined. CoreWeave's valuation core has never been single-quarter revenue—it is whether it can continuously secure financing at an acceptable cost. This rally priced in the alleviation of short-term solvency concerns more than it priced in the viability of the business model.
AMD's problem becomes clearer when viewed in the same frame. Third-quarter revenue was $13.377 billion, up about 16% quarter over quarter, with data center business reportedly nearly doubling to $8.5 billion. Its test is whether revenue can convert into cash. According to media reports, its free cash flow fell from $1.56 billion in the prior quarter to $554 million. The quality of growth needs to be verified by cash flow in subsequent quarters.
Each of the four names has its own test. For Nvidia, it is whether earnings can re-support valuation. For Micron, it is whether profits can be sustained. For AMD, it is whether revenue can convert into cash. For CoreWeave, it is whether revenue can cover financing. The re-ranking within AI is simply the answers to these four questions.
6. A December Rate Hike Is Already Priced In; the 10-Year Treasury Is the Master Switch for AI Valuations
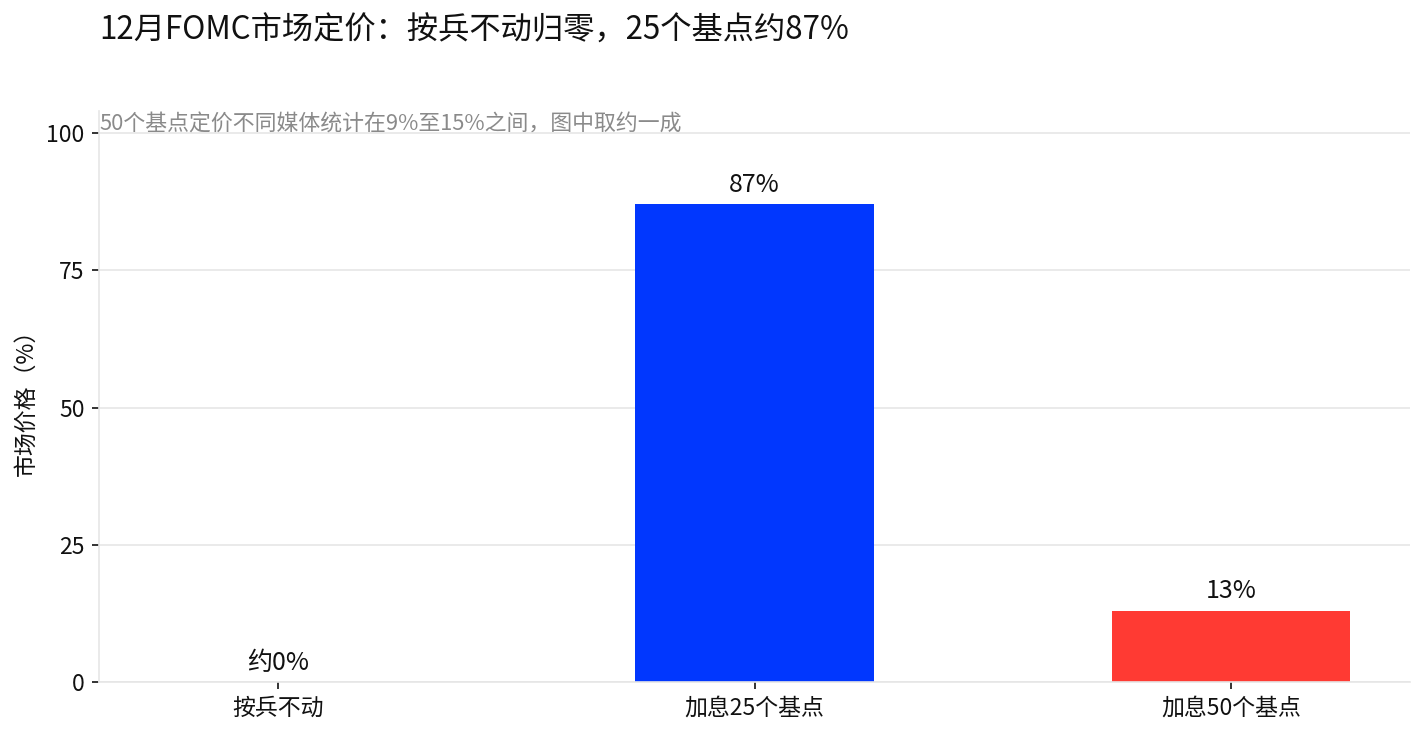
After October CPI was released, according to CME FedWatch market data (cited by multiple media outlets between November 10 and 11), the probability of holding steady on December 9 fell to zero, the probability of a 25-basis-point hike was about 87%, and the probability of a 50-basis-point hike was about 10%, with different media reporting between 9% and 15%. Some institutions have incorporated another rate hike in early next year into their forecasts; according to media reports, such views represent only the judgments of the respective institutions. The December hike itself has already been priced in by the market—short-end rates are not the biggest variable going forward.
What truly affects AI pricing is the long end. The 10-year US Treasury yield closed at 4.998% on November 10, hugging the 5% threshold—it is the discounting benchmark for growth stock valuations. The criteria for judgment are therefore very specific: if the 10-year Treasury yield retreats and QQQ holds firmly above its 200-day line, AI assets have room to recover their discounts. If the 10-year Treasury yield breaks back above 5%, the discounting pressure on high-valuation long-duration cash flows will intensify again, and the structure above the 200-day line will need to be re-examined. Watching the 10-year Treasury is more useful than watching whether it is 25 or 50 basis points.
7. Stop Watching Only QQQ: Five Signals Determine Who Keeps Running Within AI
Final Thoughts: QQQ Back at Its 200-Day Line Does Not Mean AI Is Re-entering a Broad Rally
What is truly noteworthy about this rebound is not that QQQ has finally reclaimed its 200-day moving average, but that repricing within AI has already begun. AMD stands 31.6% above its 200-day line, Micron is 6.5% above, while Nvidia and CoreWeave remain 15.0% and 32.1% below, respectively. Under the same AI theme, capital's answers have already become completely different.
Going forward, stop using "will AI rise" as the sole judgment. For Nvidia, watch whether governance and earnings can re-support valuation. For Micron, watch whether HBM prices can prove profits are not at a cyclical peak. For AMD, watch whether revenue growth can convert back into free cash flow. For CoreWeave, watch whether financing costs can improve alongside business growth. If these signals gradually strengthen, QQQ holding its 200-day line could evolve from a technical repair into a trend repair. If the index continues to rise while these fundamental signals fail to keep pace, be wary of another pattern where the index outperforms individual stocks. The index has completed its repair; individual stocks are now being tested—this phrase will likely dominate AI trading before the December FOMC meeting.
Disclaimer:
This content is for general informational and market commentary purposes only, based on publicly available information as of the time described herein. Relevant market data, expectations, and probabilities may change with market conditions. The views and investment strategies of third-party institutions, analysts, or other individuals cited herein represent only the views of the relevant third parties at specific times and do not represent the views or recommendations of BIT. This article does not constitute investment advice, investment research, an offer, solicitation, or recommendation of any securities, investment products, or trading strategies, and should not be relied upon as the basis for any investment decision. Financial markets involve risk; securities prices and market performance may fluctuate, and historical performance and past market trends do not represent or guarantee future results. Investors should independently assess relevant risks based on their own circumstances and seek professional advice when necessary.