Deutsche Bank Reviews Historical Patterns of US Stocks: Post-Midterm Elections Tend to Rally, But This Time Could Be Different


- Key Takeaways: Deutsche Bank research shows that since 1946, the S&P 500 has posted gains in all 12-month periods following midterm elections. However, current index concentration is at an all-time high, and a handful of mega-cap stocks will determine whether this winning streak can continue.
- Key Elements:
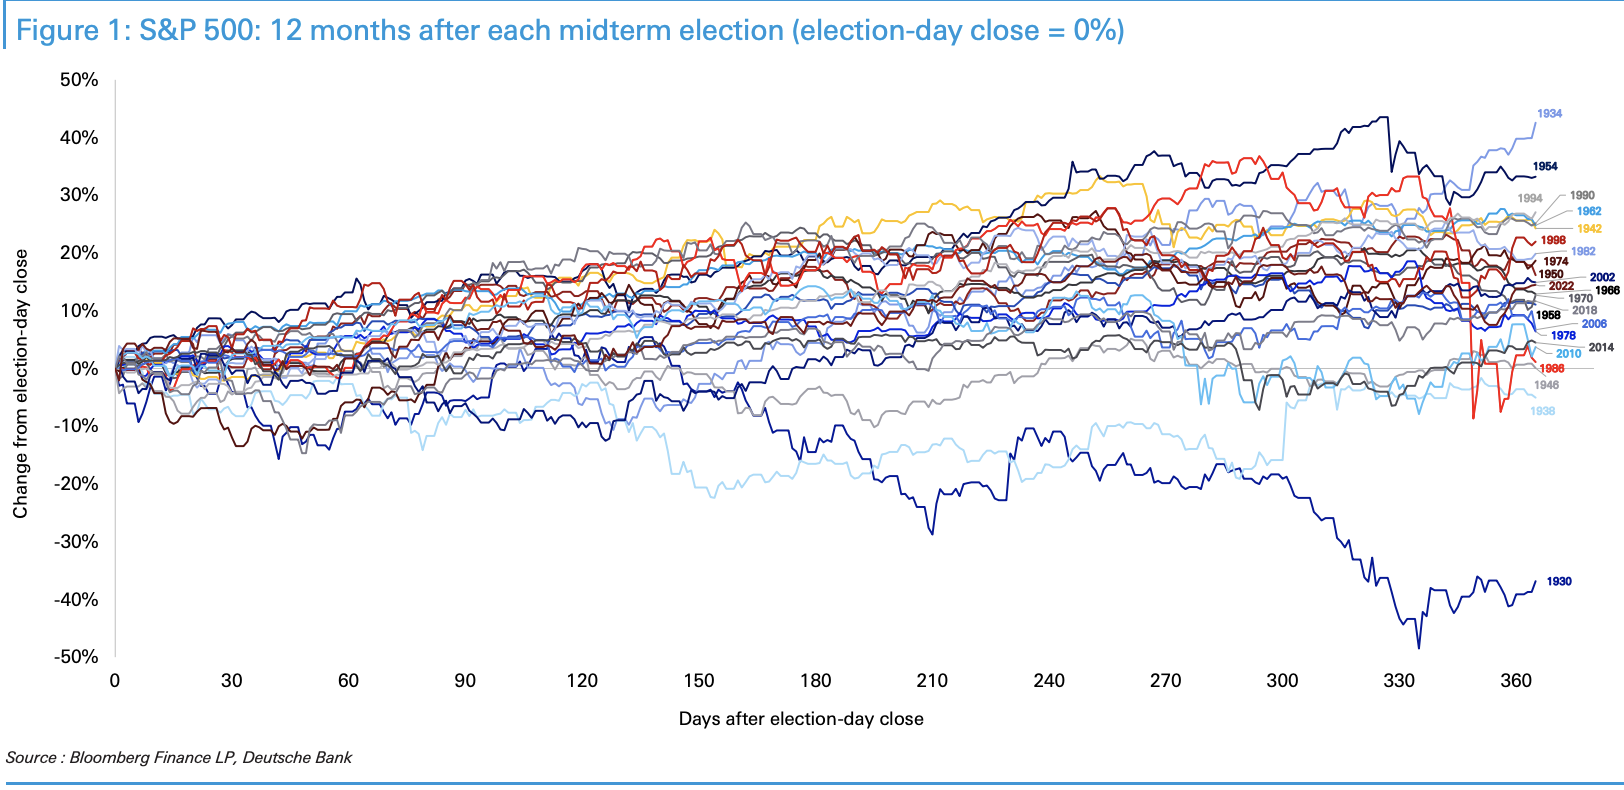
- Since 1946, the S&P 500 has risen in all 20 instances in the 12 months following midterm elections, with an average gain of 14.4%, a median of 13.7%, and a 100% win rate.
- Extending back to 1930, 22 of 24 instances saw gains, a 92% win rate, with only 1930 during the Great Depression (-37%) and 1938 amid war clouds (-5.1%) as exceptions.
- Average performance in the year after midterm elections leads ordinary years by roughly 4 to 5 percentage points, driven by the removal of political uncertainty and a divided government reducing policy risk.
- Current S&P 500 concentration exceeds all historical samples, and the performance of a few heavyweight stocks could be the primary way the 92% win-rate record gets broken.
- After midterm elections, 10-year Treasury yields tend to decline, with larger drops under a divided government; every 2% decline in the S&P 500 corresponds to roughly a 10 basis point decline in Treasury yields.
- The Fed's rate hike path constitutes another variable. Current pricing reflects one of the mildest hiking cycles in history, and a return to normal levels would hit the market.
Author: Zhao Ying
Source: Wallstreetcn
Historical data provides strong support for U.S. stock market performance after midterm elections, but the current market structure's exceptional concentration poses an unprecedented challenge to this pattern.
According to Deutsche Bank's latest research report cited by the Trading Desk, since World War II, the S&P 500 has posted gains in the 12 months following every midterm election—all 20 instances were positive, with an average gain of 14.4%. This record far exceeds the average performance of ordinary years.
However, Deutsche Bank strategists also warned that current index concentration is the highest among all the historical samples cited above, and the performance of a handful of mega-cap stocks will largely determine whether this winning streak can extend to a 22nd consecutive occurrence.
On the rates market side, Deutsche Bank's fixed income strategists noted that 10-year U.S. Treasury yields tend to decline after midterm elections, with the drop being more pronounced especially when the election results produce a "new divided government" configuration. Combined with the current expectation that Democrats will likely win the House, the market's pricing logic around policy gridlock may dominate rate movements in the near term.
Near-Perfect Historical Win Rate, Gains Significantly Outperform Ordinary Years
The Deutsche Bank report systematically reviewed the S&P 500's 12-month performance after every midterm election since 1930, and the conclusion is highly consistent: gains are almost the norm.
Specifically, since 1946, the S&P 500 has risen in the 12 months following midterm elections 100% of the time—all 20 instances recorded positive returns, with an average gain of 14.4% and a median gain of 13.7%. Extending the time window back to 1930, 22 of 24 elections recorded gains, a win rate of 92%, with an average gain of 13.0% and a median also of 13.7%.
By comparison, the probability of gains across all calendar years since 1928 is only 67%, with an average gain of 8.1% and a median of 11.6%; the average gain in ordinary years since 1946 is also just 9.1%. This means that the average performance in the year after a midterm election leads ordinary years by roughly 4 to 5 percentage points at the mean level and by about 2 percentage points at the median level. All the above figures are price returns and exclude dividends.
Two Exceptions: Market Crashes Under the Great Depression and War Clouds
Among the 24 samples, only two recorded market declines in the 12 months following a midterm election, both occurring under extreme macroeconomic conditions.
In 1930, the shadow of the Great Depression loomed over the market. A wave of bank failures, deflation, and the enactment of the Smoot-Hawley Tariff Act all weighed on the market, and the S&P 500 plunged 37% in the 12 months after the election. Deutsche Bank characterized this as "a once-in-a-century financial and economic collapse, rather than an ordinary political cycle year."
The situation in 1938 was similarly exceptional. The recession of 1937-1938 had just ended, war clouds were gathering over Europe, and the market fell 5.1% in the 12 months after the election. In addition, 1946 was nearly another exception—postwar inflation and demobilization pressures weighed on the economy, and the market rose only 0.1%, essentially flat.
The Logic Behind the Pattern: Removal of Uncertainty Drives Valuation Recovery
The Deutsche Bank report points out that the fundamental reason the market tends to rise after midterm elections is the systematic elimination of political uncertainty.
Within the four-year political cycle, midterm election years are typically the weakest phase for market performance. Uncertainty surrounding election results and policy direction peaks before the vote, and the market often bottoms in the fall—historically, the average low has occurred at the end of September. After the election concludes, the market is buying a "known outcome." And the typical outcome of midterm elections is a divided government and policy gridlock, which actually reduces the risk of major policy changes and constitutes a positive for the market.
The Deutsche Bank report also noted that 2026 differs from previous years: the market did not experience the large decline customary in history this year, but has largely traded sideways since late May, which to some extent still reflects the customary softening of the market before the vote.
The Biggest Variable This Cycle: Index Concentration at a Record High
Despite the highly optimistic historical data, Deutsche Bank strategists explicitly flagged the core risk of this cycle: unprecedented index concentration.
The report notes that the current concentration of the S&P 500 exceeds that of any period in the historical samples cited above, with a handful of mega-cap companies contributing the vast majority of index returns. This means that even if most stocks rise, the index as a whole could still post a decline if a few core heavyweight stocks deliver disappointing performance. Deutsche Bank believes this is precisely the most likely way the 92% win-rate record could be broken.
In addition, the Federal Reserve's policy path constitutes another important variable. The report notes that the rate-hiking cycle currently priced by the market is one of the mildest in history, and if the actual rate path returns to historically normal levels, it would constitute a shock to the market.
Rates Market: Divided Government Expectations Push Down Treasury Yields
On the rates side, Deutsche Bank's fixed income team's research shows that 10-year U.S. Treasury yields have tended to decline after midterm elections over the past 60 years, and the decline is notably larger when the election results produce a "new divided government" configuration—the market typically interprets this as a signal of policy gridlock and lower fiscal stimulus.
The report also notes a significant positive correlation between equity market and rates market movements after elections. Historical experience shows that for every 2% decline in the S&P 500 in the week after an election, the 10-year Treasury yield corresponds to a decline of roughly 10 basis points. Given that the direct policy impact of this election's outcome is limited, Deutsche Bank strategists believe rate movements will largely follow the direction of the equity market.
Synthesizing historical data and the current market structure, Deutsche Bank's overall judgment is: historical patterns tend to support broad market gains over the next 12 months, with both mean and median gains in the double-digit range. However, given current index concentration, whether the winning streak can extend to a 22nd consecutive occurrence will likely ultimately depend on the performance of a few core heavyweight stocks—this is the variable most worthy of investors' close attention in the market outlook following this midterm election.