ETF Nears Breakeven Line, Bulls and Bears Face Off at the Critical $64,000 Level


- Core View: The crypto market has undergone a deleveraging shakeout, with Bitcoin falling about 13% in a single week to break below $63,000. Derivatives leverage risk has largely been flushed out, but continued net outflows from spot ETFs have pushed the average ETF holdings MVRV close to the 1.0 breakeven line, placing the market at a critical inflection point.
- Key Elements:
- Total futures open interest fell 7.2% to $34.2 billion, perpetual contract funding rates have dropped back to a neutral range, and leverage overheating has largely been cleared.
- U.S. spot ETFs saw net outflows every trading day over the past week, with weekly outflows of about $995.4 million, and the overall ETF MVRV fell to 1.06.
- Short-term holders are fully in unrealized losses, with STH-NUPL turning negative to -7.4%, and realized losses hitting their highest level since July this year.
- Monthly realized cap growth plunged from 0.43% to 0.04%, indicating a significant slowdown in external new capital inflows.
- The 25-Delta skew rose to 13.7%, setting a new record for put premium since August, reflecting strong demand for downside hedging.
- The share of profitable tokens across the network fell from 60.4% to 55.3%, while the hot money share remained at a high of 22.0%.
Original Author: Glassnode Insights
Original Compilation: TechFlow
Introduction: After more than a month of narrow-range consolidation, the crypto market experienced another brutal round of deleveraging last weekend. Bitcoin fell about 13% in a single week, briefly piercing $63,000 and recording the most violent single-day swing in months.
In its Week 47 market pulse report, Glassnode noted that although overheating leverage in the derivatives market has largely been flushed out, persistent outflows from spot ETF investors are pushing the entire sector toward a critical tipping point. The average ETF holdings MVRV has approached the 1.0 break-even line.
On-chain micro data shows that loss pressure is concentrated mainly among recent entrants, with short-term holders now sitting on unrealized losses across the board. This article provides a panoramic view of off-chain derivatives and on-chain fundamental indicators to clarify the true coin distribution landscape after this major selloff.

Market Overview: Deleveraging Storm and Capitulation Wave
Bitcoin held around $64,000 on Monday after closing the prior week down about 13% cumulatively. The sharp decline began last Thursday and accelerated further over the weekend. On Saturday, prices briefly fell below $63,000, marking a new local low since late August.
This concentrated selloff rapidly cleared out the elevated leverage that had accumulated in the derivatives market over the past several weeks. Total perpetual futures open interest has slid to the lower bound of its statistical range, while long funding rates, after remaining in the high warning zone for consecutive weeks, finally cooled sharply back into neutral territory.
Meanwhile, U.S. spot ETF investors continued their net outflow trend, recording capital withdrawals on every trading day of the past week. The aggregate ETF MVRV ratio dropped rapidly to 1.06, extremely close to holders' combined break-even threshold.
Underlying on-chain activity remains relatively active, with daily active addresses and large transfer volumes holding resilient. However, paper losses are almost entirely concentrated among holders who entered over recent months. Short-term holders have fully shifted into unrealized losses, and realized losses have hit their highest peak since July of this year.
Off-Chain Derivatives Indicators: Futures Open Interest at Freezing Point and Surge in Put Options
From the aggregated monitoring of off-chain spot and derivatives dimensions, the market shows significant risk-release characteristics after the selloff.
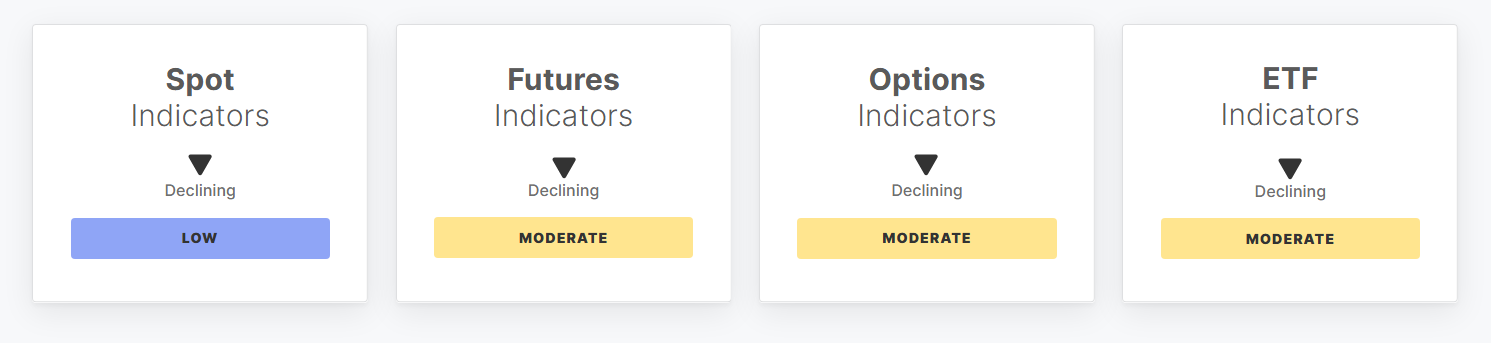
Chart: Bitcoin off-chain spot, futures, options, and spot ETF key indicators dashboard
The spot Price Momentum indicator plunged 36.1% from 35.6 a week ago to 22.8, continuing to probe lower after breaking below the lower bound last Wednesday, recording the weakest reading since August.
The Spot Cumulative Volume Delta (Spot CVD) deteriorated further from -$51.5 million to -$133.7 million. Aggressive spot taker sell orders showed violent market-selling characteristics from last Thursday through Saturday, only gradually slowing by Sunday.
Futures Open Interest declined 7.2% week-over-week to $34.2 billion, also touching the lower boundary of its range. Perpetual CVD expanded from -$493 million to -$1.4 billion, reflecting a double stampede of forced liquidations and voluntary stop-losses among speculative longs.
In the options market, the 25-Delta Skew surged 30.9% to 13.7%, setting a new put premium record since August and reflecting extremely strong demand for out-of-the-money put options to hedge downside risk.
Although the weekly net outflow from U.S. spot ETFs narrowed slightly to -$995.4 million, it remains at the bottom of the range; total weekly trading volume fell to $11.5 billion, as institutional allocations continue to choose cautious defense at this inflection point.
On-Chain Fundamentals: Short-Term Holder Losses and Hot Capital Share Peaking
Delving into underlying on-chain data, network security and asset transfers remain operational, but capital stock liquidity and the profit-loss structure have undergone profound reversals.
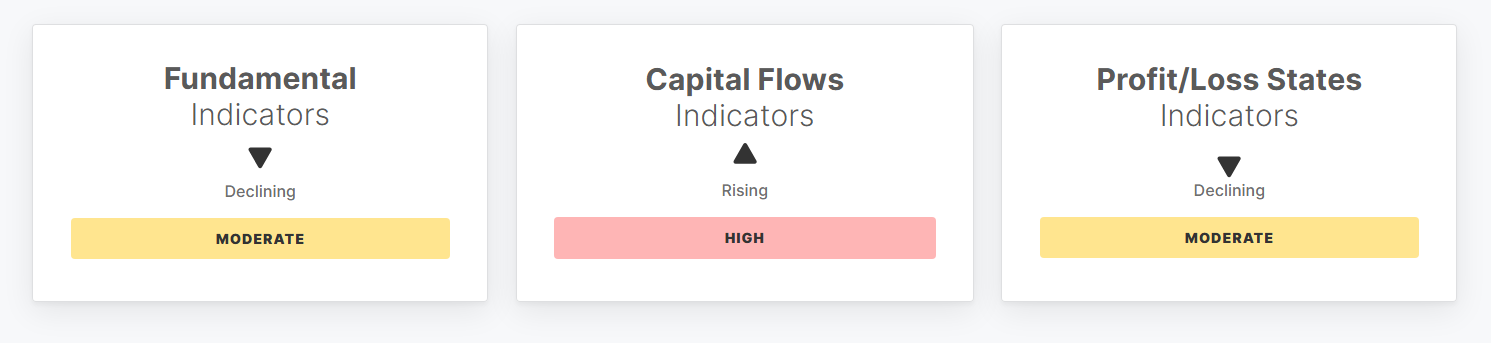
Chart: Bitcoin on-chain fundamentals, capital flows, and unrealized profit/loss status dashboard
On-chain transfer and activity volumes remain elevated, with entity-adjusted daily transfer volume increasing 3.6% to $5.4 billion, near the upper bound of its range; network-wide daily active addresses stand at approximately 659,700, slightly off mid-week highs but still within a healthy range overall.
However, the monthly growth rate of Realized Cap has nearly stalled, dropping sharply from 0.43% a week ago to 0.04%, meaning the pipeline for external new capital inflows has slowed significantly.
The STH to LTH Supply Ratio edged up to 15.1%, and the Hot Capital Share of total market cap remains at a high of 22.0%, indicating that younger coins purchased within the past three months still account for a significant trading weight.
Regarding profit-loss status, the proportion of tokens in profit across the network fell from 60.4% to 55.3%. The Short-Term Holder Net Unrealized Profit/Loss (STH-NUPL) has turned negative to -7.4%, which historically corresponds to a typical range of phased capitulation-style turnover.
Outlook and Key Observation Thresholds
Synthesizing multiple on-chain and derivatives perspectives, this crash was essentially a deleveraging process triggered by persistent spot ETF position reduction, a stampede among short-term speculative longs, and macro risk-off sentiment.
Current futures open interest and funding rates have both departed from dangerous overheating levels, and pure leverage risk at the derivatives level has been substantially cleaned up. However, when spot ETF net outflows will turn positive, and whether stop-loss capitulation among short-term holders will spread to long-term DCA believers, will be the decisive forces determining whether the $64,000 threshold can form a solid bottom structure.