How hard is it to "guess" this round of US stock earnings season, when only 3 out of a thousand participants managed multiple consecutive correct calls?


- Core Viewpoint: This round of US stock earnings season shows that corporate earnings broadly beat analyst benchmarks but are no longer scarce information. Earnings "crossing the line" has limited correlation with first-day stock price gains; what the market is truly testing is growth quality, sustainability, and valuation tolerance.
- Key Elements:
- Among the 48 forecast events for 24 companies tracked by OKX Planet, exactly half saw earnings results move in the opposite direction of first-day price action; of the 16 companies whose results crossed the line, only 7 rose on the first day (43.8%).
- Earnings forecasts 3 hours before reports skewed optimistic: 20 leaned Yes, but only 16 ultimately met the mark; of the 6 misses, 5 were "bullish but did not cross the line," involving SK Hynix, Alphabet, Amazon, Robinhood, and Meta.
- As results approached, judgment revisions mainly occurred in price forecasts (consensus count rose from 17 to 24), while earnings forecasts remained unchanged (18), indicating that new information and market feedback helped revise market calls rather than profit estimates.
- Case divergence: Robinhood posted record revenue but earnings per share declined, with crypto revenue down 55%; SK Hynix missed metrics but its HBM4 long-term contract covers more than half of capacity for 2027–2028; Microsoft's profit grew but the gap between operating cash flow and capital expenditure fell about 27% year over year; AMD's revenue rose 45%, data center revenue rose 97%, margins improved, and it issued strong guidance.
- The S&P 500 forward P/E fell from 19.0x at the end of September to 17.7x on November 6; valuation contraction and weakening corporate earnings were not synchronized.
- In the second installment of "Earnings Big Winner," among more than 1,400 participants, only 3 answered 26 questions correctly in a row to tie for first place; all three first faltered on SK Hynix, and in the final round they jointly misjudged that AMD and Circle would not rise on the first day.
Currently, although the US stock market's Q3 earnings season has not fully ended, the peak of concentrated disclosures has already passed. Looking back at the companies that have reported, what is most noteworthy is not how many more have "beaten expectations," but that earnings reports and subsequent price action sometimes move in the same direction and sometimes diverge. According to the settlement results of relevant OKX prediction events, AMD's Q3 revenue grew 45% year-over-year, its performance reached the preset threshold, and its price rose on the first full trading day after the earnings release; Robinhood's revenue hit a record, but its specified earnings per share fell short, and its price did not rise on the first day. SK Hynix's quarterly revenue and operating profit also set records, its specified profit metric fell short, yet its price rose on the first day; Microsoft and Apple, by contrast, cleared their performance thresholds but saw no price increase.
These results include both expected growth and surprises significant enough to make one pause and re-examine the question. Whether AI investment can be converted into profit, whether consumer demand will continue, and how high the revenue quality of financial platforms is—these companies were never answering the same question. OKX Planet split two of these judgments into prediction events: one question asked whether the earnings report met a pre-specified threshold, and the other asked whether the price rose on the first full trading day after the earnings release. Using these two questions to review the earnings season makes it clearer how far apart "what report card the company delivered" and "what price the market is willing to pay for it" really are.
24 Companies, 12 With Opposite Answers to the Two Questions
We compiled 48 earnings prediction events on OKX Planet between October 20 and November 10, covering 24 companies with two types of questions for each company. The combinations of performance and first-day price are as follows; here, "performance cleared the threshold" follows the preset metric threshold for each event, and the price direction follows the event settlement criteria, which is not equivalent to the specific percentage change of US stock spot prices.
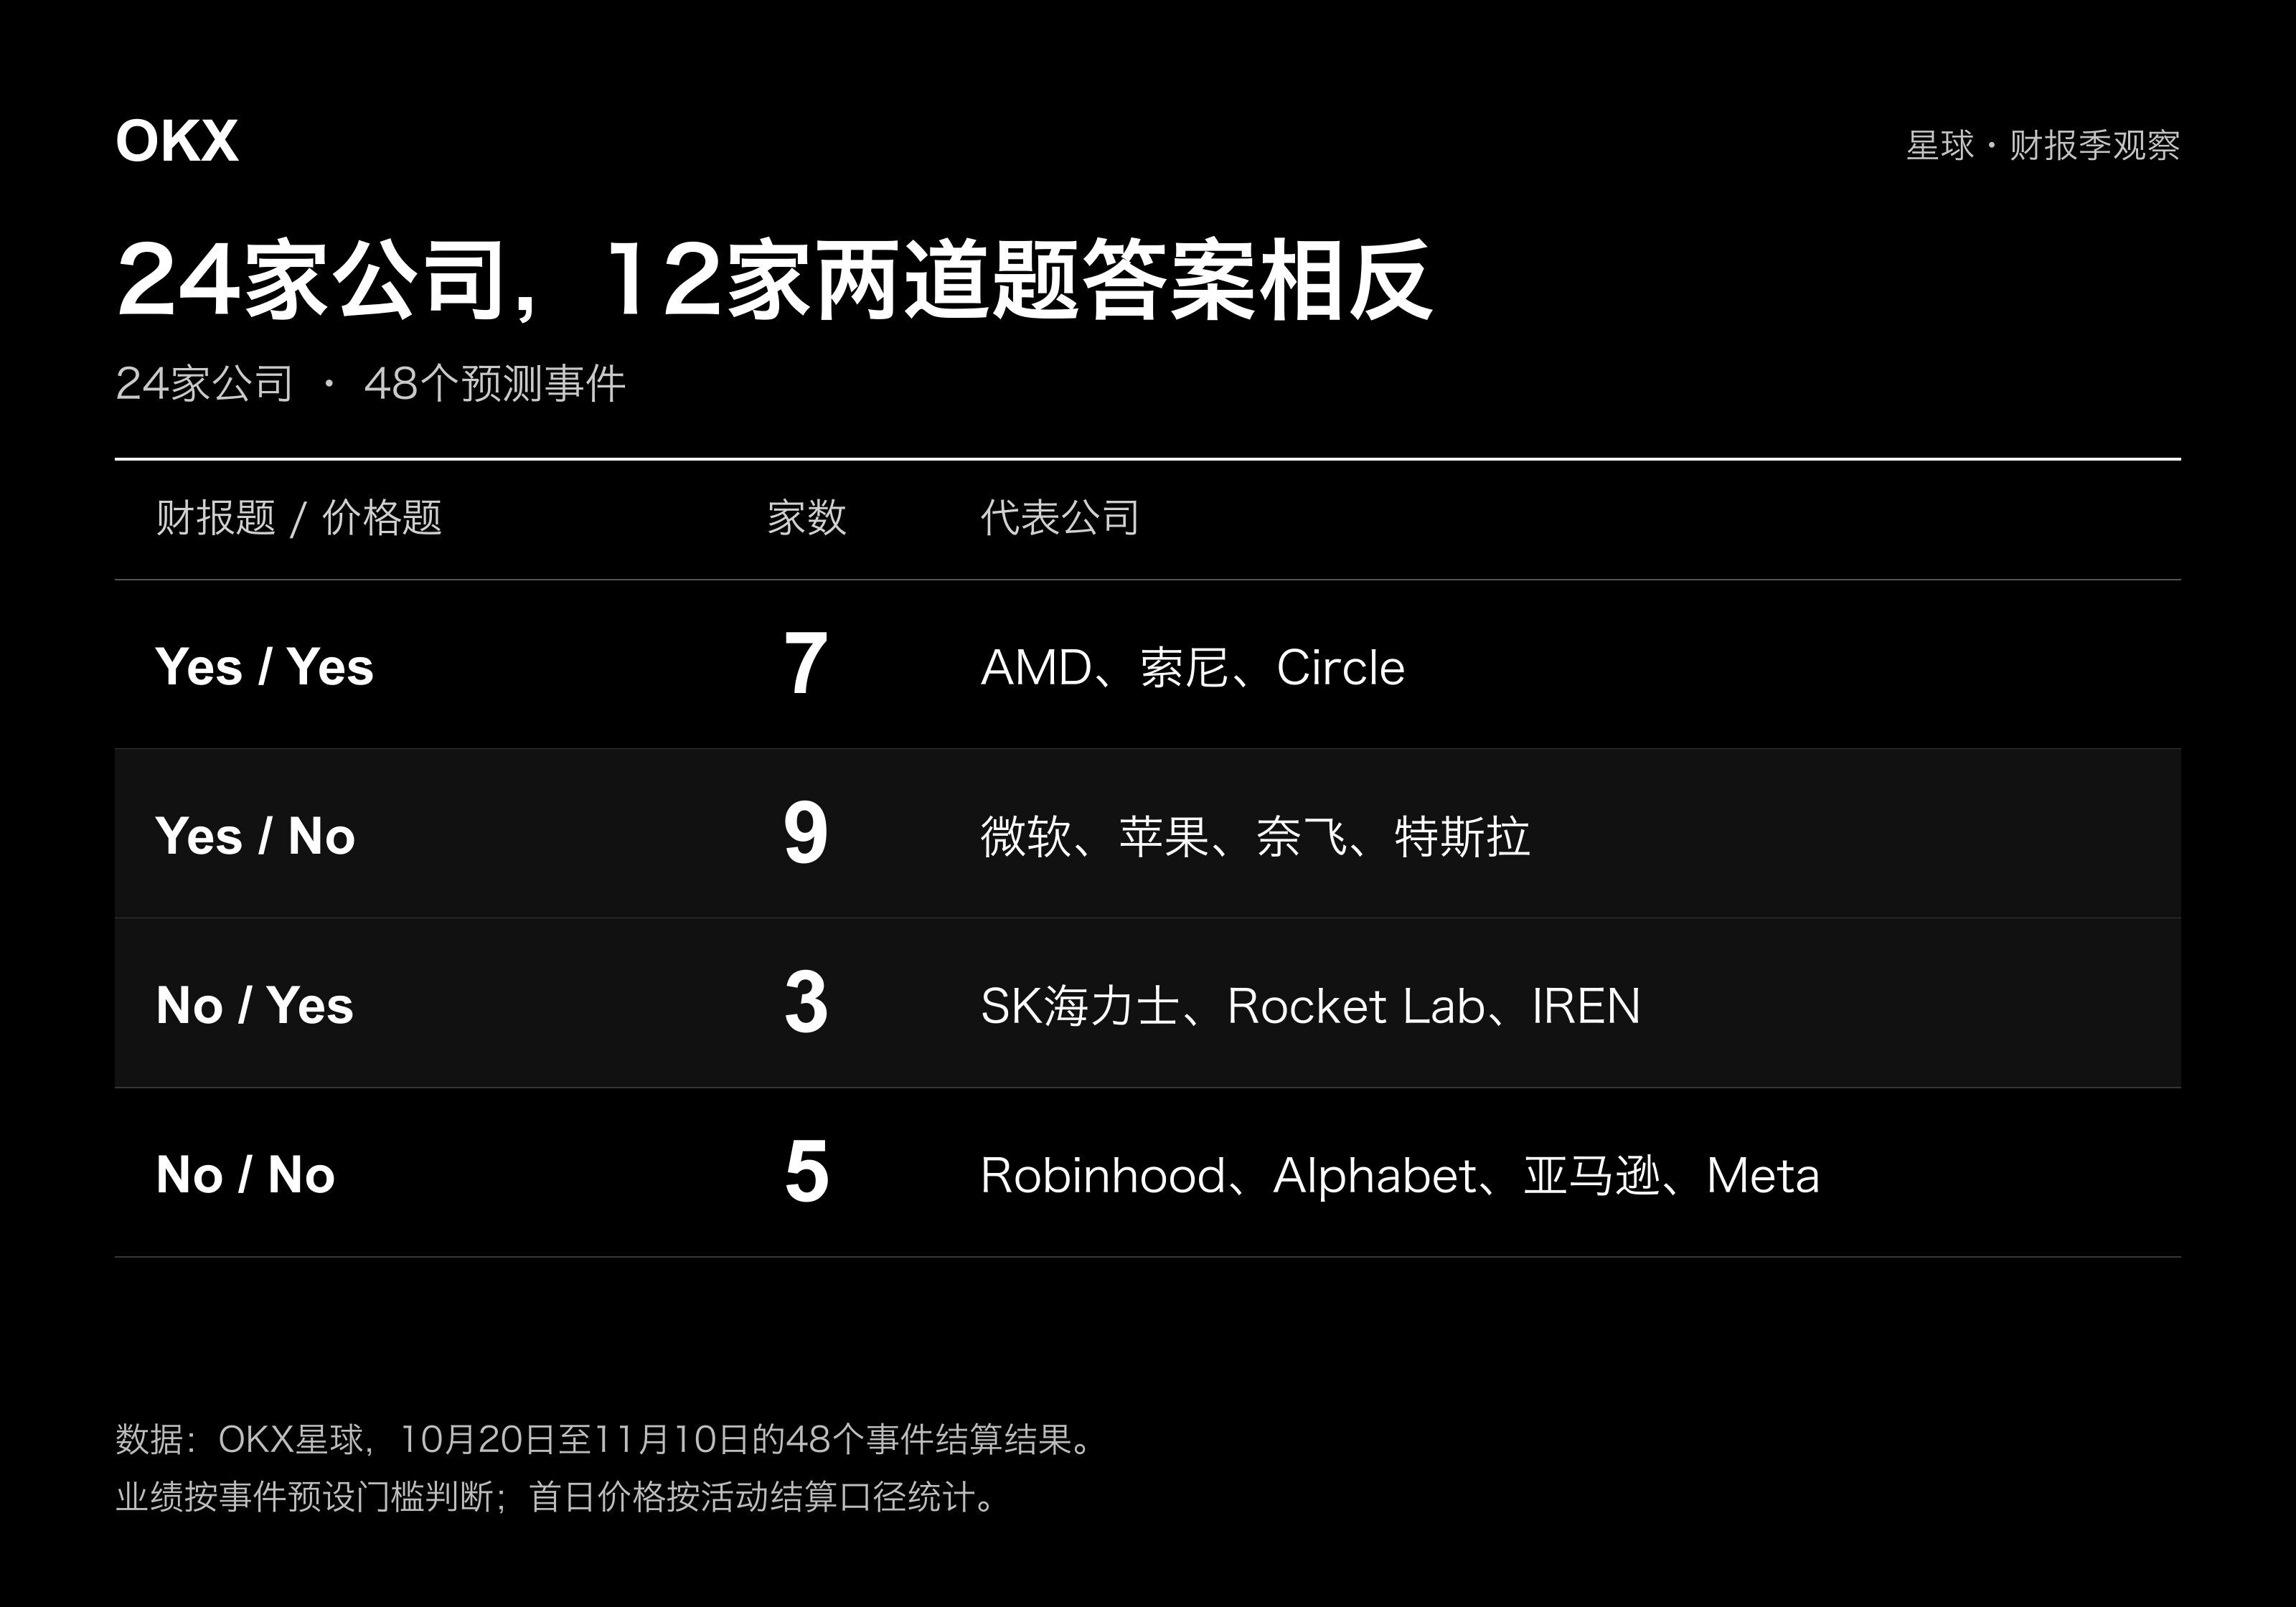
Among the 24 companies, exactly half had performance and price directions that differed. More notably, among the 16 companies whose performance cleared the threshold, only 7 rose on the first day, accounting for 43.8%; among the 8 companies that fell short, 3 still rose, accounting for 37.5%. The difference in the proportion of gains between the two groups is only about 6 percentage points.
This small sample is insufficient to estimate long-term patterns, but it shows that within this observation window, merely knowing "whether performance cleared the threshold" is of quite limited help in distinguishing whether the stock would rise on the first day. The 9 companies that cleared the threshold but did not rise certainly cannot be uniformly explained as business deterioration. They may still be growing; it is just that the magnitude, quality, or sustainability of that growth did not provide enough new reasons for the price to continue climbing.
Putting this back into the entire earnings season reveals two levels: corporate earnings generally exceeded analyst benchmarks, but "exceeding the benchmark" itself is no longer scarce information; investors also need to judge whether this earnings report can drive upward revisions to future earnings expectations. Although FactSet's S&P 500 statistics and the event thresholds for these 24 OKX companies are not on the same basis and cannot be directly compared for beat rates, the former provides background: when beats become common, what truly differentiates is by how much and whether it can be sustained; the latter provides a comparison between performance and price reaction, revealing a point that is easily overlooked when looking only at the proportion of earnings beats—clearing the earnings threshold does not mean the market is willing to assign a higher price. To understand this gap, one must further judge whether these performance improvements had already been priced in.
Does Closer to the Result Mean More Accurate Predictions?
Judgments on performance in this round of predictions were generally optimistic. Three hours before earnings releases, 20 of the 24 companies had performance predictions leaning toward Yes, while only 16 ultimately reached the threshold. Among the 6 performance questions with inconsistent direction, 5 were cases that had previously been favored but ultimately fell short, involving SK Hynix, Alphabet, Amazon, Robinhood, and Meta respectively; only Oklo produced the opposite result.
In other words, the main deviation was not a general underestimation of companies, but an overestimation of the probability that some companies would reach the profit threshold. The difference between industry boom, revenue growth, and profit realization is precisely what these companies need to be further broken down. But as the result approached, how much would these judgments be corrected? The changes in the two types of predictions were not the same.
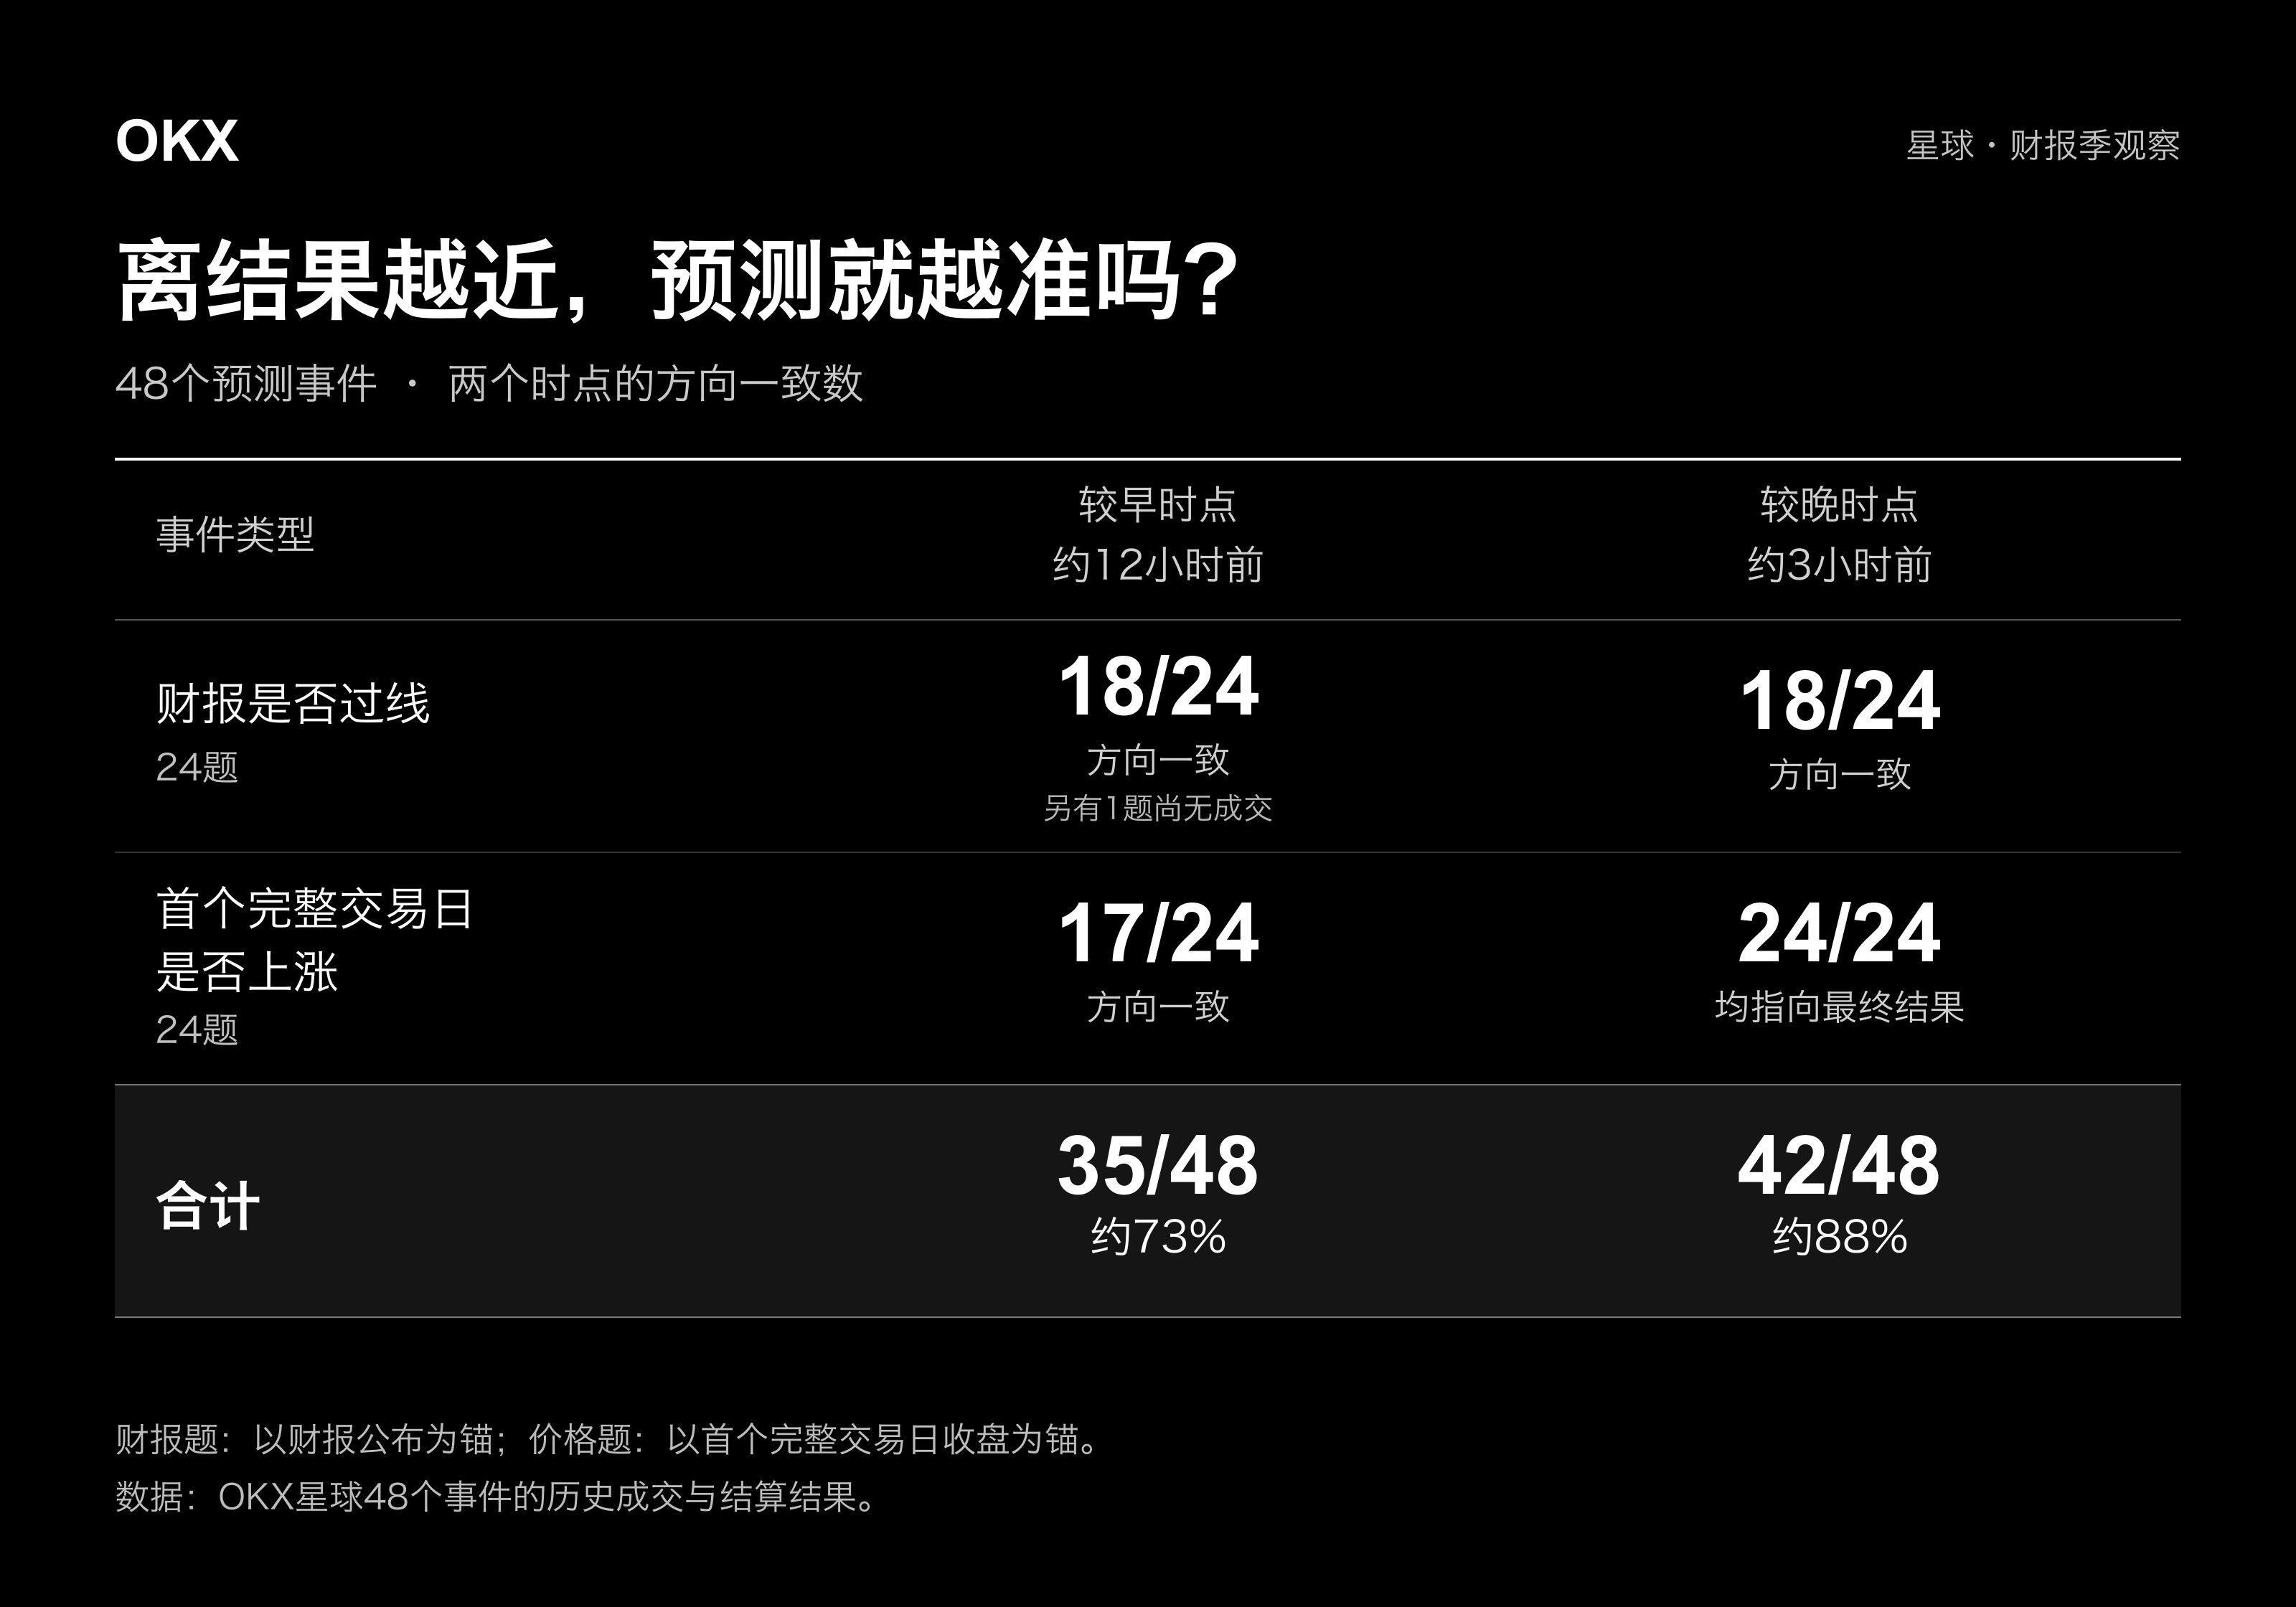
In aggregate, judgments consistent with the result increased from 35 to 42, with the proportion rising from about 73% to 88%. All 7 net additions came from price predictions; first-day up-or-down judgments increased from 17 consistent to 24, while performance predictions were 18 consistent at both time points. Therefore, the improvement shown in this dataset occurred in tracking market moves, not in advance estimation of corporate earnings.
The two face different information conditions. Before earnings are released, even if only 3 hours remain until disclosure, participants may not have obtained new evidence sufficient to change profit estimates, and their prior optimistic or pessimistic judgments may persist. When price predictions approach the close of the first full trading day, earnings have already landed, and the market has spent most of a trading day reacting, so judgments are more likely to converge toward the result. This dataset supports "new information and market feedback help correct judgments" rather than "the longer you wait, the more accurate the prediction naturally becomes." For market research, subsequent quotes can help observe whether the market accepted the initial earnings interpretation, but they cannot conversely prove that ex ante judgments were equally reliable.
How a 50% Prediction Divergence Moves Toward an Answer
A reading near 50% is still insufficient to form a clear judgment. Intel's performance question had a Yes trading price of 51% 12 hours before the release, and its performance ultimately cleared the threshold; Amazon once showed a reading of 53% but ultimately fell short. Both leaned slightly bullish, yet led to different outcomes. For such companies, what is more worth studying is where the divergence lies—for example, whether there is consensus on revenue growth, and whether there are still differing estimates for margins, expenses, or next-quarter guidance. Directly interpreting 51% or 53% as "the market is already bullish" magnifies a very small leading margin.
An even stronger inclination does not necessarily point to the correct answer either. Oklo's performance question had Yes trading prices of 20%, 18%, and 11% at 6 hours, 3 hours, and 1 hour before the earnings release, respectively, yet its performance ultimately reached the threshold. By contrast, SanDisk rose from 57% 12 hours before the release to 65% 3 hours before, with bullish inclination strengthening, and it ultimately did clear the threshold. One falling and one rising—both changes need to be explained by returning to operating information and profit estimates; changes in quotes themselves cannot replace the evidence supporting a judgment.
7 Revisions, 5 Withdrawn Bullish Judgments
Looking further at the 7 revisions in price judgments, Netflix, Microsoft, Tesla, Meta, and AST SpaceMobile shifted from leaning toward gains to leaning toward no gains; Rocket Lab and AAOI adjusted in the opposite direction. As the trading day progressed, some previously optimistic price expectations did not hold.
The relationship between predictions and market moves is not just "prediction first, verification later." Before earnings, quotes record what participants are willing to believe; after earnings, operating data, management guidance, and trading action in turn change the quotes. For analysts, the most valuable thing is to identify after what information the shift in judgment occurred. If bullish expectations continue to decline even after earnings clear the threshold, one should check whether the previously favored growth had already been priced in, or whether new guidance weakened it; one cannot infer solely from a decline in quotes which factor caused the drop.
The Earnings Numbers Are Right, So Why Does the Price Still Move the Other Way?
First, look at Robinhood. Its Q3 revenue was $1.42 billion, up 12% year-over-year, setting a record; but GAAP earnings per share fell 16% to $0.51, and adjusted earnings per share also fell 3% to $0.60. Even without discussing which basis the event used, the fact that revenue growth did not translate into earnings-per-share growth in tandem is already a question the earnings report itself needs to answer. Robinhood Earnings Release
Revenue was not uniformly strong internally either. Options and equities trading revenue grew 31% and 41%, respectively, while cryptocurrency trading revenue fell 55% and net interest revenue fell 9%. The total revenue record obscured the shift in strength among businesses. For platforms like this, whether new revenue can offset declines in existing businesses and leave more profit is more important than whether total revenue hits a new high. Its failure to clear the profit threshold and the absence of a first-day price gain are at least consistent with the earnings characteristic that "growth did not broadly improve profitability," rather than being purely a matter of settlement methodology.
SK Hynix presents another situation. Although its specified profit metric fell short, both disclosed revenue and operating profit hit new highs; the more forward-looking information is that sales of HBM4 and high-value server products expanded and have already covered more than half of capacity for 2027 to 2028 through long-term agreements. SK Hynix Earnings Release This information gives investors a basis for observation beyond the current quarter's earnings per share: whether the share of high-value products can continue to rise, and whether future capacity already has demand lined up. Long-term agreements are not a guarantee of future profit, but they help assess the visibility of growth. This is also why a miss on a certain metric for the quarter does not necessarily overturn the judgment on subsequent operations.
The divergence in the AI supply chain is easier to see between Microsoft and AMD. Microsoft's quarterly revenue grew 19%, operating profit grew 21%, and Azure revenue grew 48%—this is not an earnings report showing weak demand. But its operating cash flow was about $58 billion, and cash capital expenditures on fixed assets were about $39.37 billion; calculated as operating cash flow minus this expenditure, the difference is about $18.63 billion, lower than $25.66 billion in the same period last year, a decline of about 27%. This calculation does not include finance lease investments. Microsoft Earnings Report and Cash Flow Statement
Profit is growing, but the cash left after investment has decreased, indicating that business expansion still requires faster capital input. For cloud platforms, what needs to be proven next is not only that "customers need AI," but also whether newly added computing power can continue to be used, whether pricing can cover investment, and how depreciation and operating costs will affect future profit. Microsoft cleared its performance threshold but its first-day price did not rise; this can be further studied along this line, rather than simply attributing it to "the market failing to understand a good earnings report."
AMD sits at the other end of the same investment chain. Its Q3 revenue grew 45%, data center revenue grew 97%, and GAAP operating margin rose from 14% in the same period last year to 21%; Q4 revenue guidance has a midpoint of about $17 billion, corresponding to year-over-year growth of about 66%. AMD Earnings Release Here there is not only revenue growth, but also margin improvement and next-quarter growth expectations. Compared with merely clearing the single-quarter profit threshold, this set of information is more helpful in supporting the judgment that growth can continue.
Putting the two companies together does not mean that companies buying equipment must fall and companies selling equipment must rise; rather, the same round of AI investment leaves different traces on different companies' financial statements. Platforms bear the construction and payback cycle first, while suppliers may recognize revenue and profit earlier. One cannot expect them to deliver the same cash returns in the same quarter just because both benefit from AI.
Apple offers another clue. Quarterly revenue grew 12% and earnings per share grew 14%, but earnings per share included a favorable tariff refund of about $0.05, which also benefited gross margin by about 1 percentage point. Apple Earnings Report This does not deny growth in the core business, but it means that when judging next quarter's profit, one must distinguish which improvements can continue and which come from special factors in the current period. The earnings numbers are real, but sustainability still requires a separate judgment.
The trend these cases jointly point to is that the quality and timing of growth explain corporate differences better than a single profit threshold. To further explain first-day market moves, one must also place earnings reports alongside prior valuations, sector performance during the same period, and management guidance, rather than merely picking a number from the report that matches the direction of the price move.
A Thousand Predictions, Only Three Multi-Win Streakers Answered 26 Questions
Turning from the overall sample to individual judgments adds another layer of difficulty. The second season of OKX Planet's "Earnings Big Winner" attracted more than 1,400 participants; by the middle stage of the competition, only Lin Moyang, abingttt, and Speculation Lab remained. The three answered 26 questions in multi-win streaks, tied for first place, split 10,000 USDT, and received about 3,333 USDT each, having each used one revival opportunity during the period.
The difficulty of a continuous challenge lies in the fact that the research subject keeps changing. Cloud platforms, chipmakers, trading platforms, and consumer electronics companies have different variables affecting profit and valuation. The reasons that were correct in the previous round may no longer be the most important factors for the next company. Interviews with the three contestants during the competition left a record of how they handled this difference.
First Miss: All Three Stumbled on SK Hynix
The first miss for all three occurred on SK Hynix. Lin Moyang and abingttt missed on the performance question, while Speculation Lab missed on the first-day up-or-down question. In an in-competition interview, Lin Moyang mentioned that he misunderstood the relationship between the trading deadline and the settlement snapshot, and also adjusted his judgment to earn XP, consuming a revival opportunity. His research habit is to collect information along the upstream and downstream supply chain, use AI to integrate materials on company business and industry development, and then discuss and verify. The value of this method lies in placing a single company's growth back into the industrial chain: Microsoft's investment can become supplier demand, but one must continue checking whether orders, deliveries, and profits correspond.
Also missing on SK Hynix, the performance question and the up-or-down question exposed different problems: the former requires rechecking profit estimates, while the latter requires understanding why the market was still willing to trade future demand when the quarterly metric fell short of the threshold. This also corresponds to the divergence that repeatedly appeared in this round: industry boom does not guarantee that every profit metric will meet the threshold, and a profit miss does not automatically erase future growth value.
abingttt and Speculation Lab also had somewhat different methods. abingttt put earnings per share, revenue, consensus expectations, and company guidance together and checked how much optimism had already been reflected in the price before earnings; Speculation Lab separated profit estimates from price judgments, referenced option implied volatility and the long-short ratio of OKX perpetual contracts, and also looked at Planet discussions opposite to its own direction. These sources of information each have their uses: earnings help estimate how much a company can earn, while derivatives and prediction quotes help observe what the market has already bet on; the two cannot substitute for each other.
What Questions Did the Three Streakers Finally Get Wrong?
In the final round, all three judged that AMD and Circle would not rise on the first full trading day after their earnings releases, but the actual results were gains for both. Both companies reached their performance thresholds, and first-day price action also rose in the same direction; this time, what all three got wrong together was not the profit judgment, but the price judgment.
From the earnings reports themselves, AMD simultaneously offered data center expansion, margin improvement, and subsequent growth guidance, so one cannot simply assume it would repeat the same path just because Microsoft and Apple previously "cleared performance thresholds but did not rise." Studying earnings requires both identifying anomalies and accepting that strong performance and rising prices can indeed move in the same direction. "Beating expectations and still falling" is only one scenario to guard against; it should not become another mechanically applied formula.
As the Earnings Season Wraps Up, What Usable Judgments Remain?
The judgment more worth retaining from this earnings season is not "whether US corporate performance is good or bad," but that profit growth, growth quality, and valuation tolerance are being tested separately. In FactSet statistics, the S&P 500's forward price-to-earnings ratio fell from 19.0x at the end of September to 17.7x on November 6. A decline in the multiple of price relative to future earnings expectations does not mean corporate earnings are weakening in tandem. Subsequent earnings still need to be verified along several directions: