Huobi HTX Chief Analyst Review: Three-Phase Price Action and Long-Cycle Support/Resistance Levels of Representative Tokens Across Ten Major Sectors Over the Past Year


- Core Viewpoint: Over the past year, the crypto market has exhibited a three-phase divergent trend of "decline—recovery—secondary pullback." Among the ten major sectors, only HYPE (+115.7%) and ZEC (+232.0%) recorded positive returns. Assets with real cash flows significantly outperformed purely narrative-driven assets, and long-cycle Fibonacci levels became precise coordinates for bulls and bears to disagree.
- Key Elements:
- BTC hit a high of $107,736 and a low of $57,761 within the window, with a maximum drawdown of 44.4%—the shallowest among the ten coins. The current price of $80,693 has reclaimed the 61.8% level ($76,852) on volume and is approaching the 50% level ($82,749).
- ETH and SOL saw maximum drawdowns of 55.7% and 62.5% respectively, deeper than BTC. SOL's current price of $96.29 remains stuck between the 61.8% level ($102.77) and the 78.6% level ($84.03).
- BNB's current price of $720 sits precisely at the 61.8% retracement level of $721. Its one-year decline of 24.2% is second only to BTC, reflecting the defensive attributes of exchange platform token cash flows.
- DOGE fell 52.9% over the year, the weakest among the ten coins. Its current price is only 14% above its one-year low and has broken below the 78.6% level ($0.090), making it a liquidation sample of a Meme asset without a cash flow anchor.
- TAO precisely rebounded about 8% from the 78.6% level ($219.5) within two days, LINK reclaimed the 61.8% level ($10.74), and XRP is bouncing back toward the 78.6% level ($1.33) but has not yet reclaimed it.
- Three future main threads: the Fed's rate path determines the valuation center; "pricing by returns rather than narrative" continues to deepen; structural events such as XRP/SOL spot ETFs, marginal privacy regulation, and bank-grade RWA implementation may catalyze independent rallies.
 Cloud, Chief Analyst at HTX, recently released an annual review report, outlining the price action and long-cycle support/resistance levels of representative tokens across ten sectors over the past year, aiming to help users understand where various assets stand amid a diverging market. The full report follows.
Introduction: A Year in Three Acts, a River of Divergence
The crypto market over the past year was not a simple bull-bear switch, but a complete three-act sequence of decline—recovery—second pullback. We selected the most representative asset from each of ten sectors—store of value (BTC), smart contract L1s (ETH, SOL), exchange platform tokens (BNB), cross-border payments (XRP), Meme culture (DOGE), oracles (LINK), DeFi derivatives (HYPE), privacy (ZEC), and AI compute networks (TAO)—based on HTX USDT-margined perpetual contract daily data, tracing the full 367-day price action from November 4, 2025 to November 5, 2026. A note on methodology: all "highs" and "lows" in this article refer to data within this one-year window; historical extremes falling outside the window (such as BTC's all-time high of $126,199.6 recorded on October 6, 2025) are noted separately; long-cycle Fibonacci calculations all use the one-year high-low range as their framework.
The selection logic for the representative token of each of the ten sectors is shown in the table below; each chapter heading below indicates its sector:
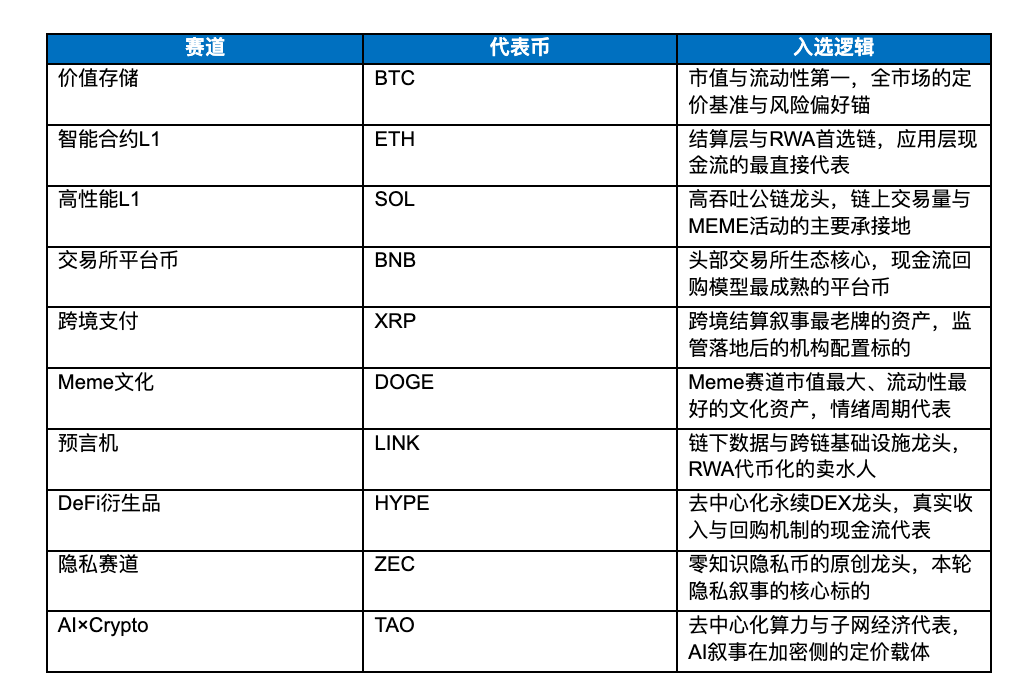
First, the conclusions. The first act was the top zone from October to early November 2025: BTC touched $126,199.6 on October 6, 2025, its 2025 high (also its all-time peak, which falls outside this article's one-year window); after entering the window, it recorded an intra-window high of $107,736 on November 4; ETH, SOL, XRP, DOGE and other major assets peaked almost simultaneously in the same month. The second act was the deep bear market of the first half of 2026: BTC touched a one-year low of $57,761 on July 1, 2026, a maximum drawdown of 44.4% from the window high; the lows of ETH, SOL, LINK, and TAO also clustered in February and June 2026, with maximum drawdowns generally between 55% and 65%. The third act was the Q3 recovery and the October–November second pullback: most assets rebounded over 50% in Q3 before weakening again, giving back a considerable portion of the recovery.
Divergence was the defining feature of this year. Only two of the ten tokens posted positive returns: HYPE rose 115.7% and ZEC rose 232.0%—the former representing the real cash flows of decentralized derivatives, the latter the powerful return of the privacy narrative; while the weakest, DOGE, fell 52.9% over the year and sits only 14% above its one-year low. Positions have shifted markedly over the past two days: BTC at $80,700 has reclaimed the 61.8% retracement level ($76,852) on volume and is approaching the 50% level ($82,749); BNB at $720 is sitting precisely on the 61.8% level ($721)—another precise long-cycle level hit following BTC; LINK has likewise reclaimed the 61.8% level; TAO bounced precisely about 8% off the 78.6% level ($219.5); XRP is retesting the 78.6% level ($1.33) from below; only DOGE remains deep below the 78.6% level. Long-cycle levels are not mysticism—they record the market's pricing memory of a complete range; when price happens to rest at these levels, the disagreement between bulls and bears converges there as well.
1. BTC (Store of Value): Precisely Holding the 61.8% Level, the Anchor of Major Tokens
Price review. BTC completed the full three-act script over the past year: after recording the one-year window high of $107,736 on November 4, 2025, it fell below $83,000 in late November, then ranged broadly between $87,000 and $93,000 from December through January of the following year; it accelerated downward in Q2 2026, recording a one-year low of $57,761 on July 1, a maximum drawdown of 44.4%; after recovering above $80,000 in Q3, it pulled back again with the market to $76,511 in October–November, reclaimed the $80,000 mark on volume on November 4, and now trades at $80,693, with its one-year cumulative decline narrowing to 21.8%; it currently sits 25.1% below the window high and 39.7% above the low. Among the ten tokens, BTC's one-year decline and maximum drawdown are both the shallowest; it remains the main channel of this river—the relative strength of all other assets should be measured against BTC as the benchmark.
Long-cycle levels. Calculated using the one-year window high-low range of $107,736–$57,761, BTC precisely retested the 61.8% retracement level of $76,852 on November 4 and reclaimed it on volume; it now trades at $80,693, back above the 61.8% level and about 2.5% from the 50% retracement level of $82,749. Downside support is, in order, the reclaimed 61.8% level of $76,852 and the 78.6% retracement level of $68,456; upside resistance is, in order, the 50% retracement level of $82,749 and the 38.2% retracement level of $88,645. A higher-order reference is the all-time high of $126,199.6 on October 6, 2025: using that high and the $57,761 low as the framework, the 50% retracement level is around $91,980, the 61.8% retracement level around $83,905, and the 78.6% retracement level around $72,387. The two frameworks corroborate each other—the $82,700–$83,900 zone is the upside resistance band (where the window-based 50% level and the ATH-based 61.8% level overlap); a valid breakout would move the recovery into its main advance; to the downside, $76,852 turns from resistance back into support, and a break below would bring $72,400 and $68,500 into view, which is also the dense cost zone near the gap origin of September's recovery rally.
Future drivers. First, ETF fund flows: spot ETFs have seen multiple weeks of net outflows in 2026 (including $203 million in net outflows in a recent week); institutional marginal capital has been the marginal price-setter over the past two years, and whether it reverses course determines whether the range can break upward. Second, the macro rate path: shifting bets on whether the Fed will hike in December directly affect risk appetite, and every print of nonfarm payrolls and inflation data will be amplified. Third, on-chain structure: long-term holder supply, exchange balances, miner revenue and other on-chain indicators often lead price bottoms in the late stage of a deep bear market; Q3's recovery validated this once, and whether signals reappear during the second pullback is worth tracking. Fourth, treasury company behavior: disclosures of accumulation or reduction by listed treasury companies have become an independent source of short-term BTC volatility.
2. ETH (Smart Contract L1): Back Below the 61.8% Level, Awaiting Application-Layer Cash Flows
Price review. ETH recorded its one-year window high of $3,682 almost in sync with BTC on November 4, 2025, but its downward slope was markedly steeper: it recorded a one-year low of $1,504 on June 6, 2026, a maximum drawdown of 55.7%, deeper than BTC's 44.4%; the Q3 recovery briefly broke above the 50% retracement level before pulling back again in October–November; it rebounded on volume with the market on November 4 and now trades at $2,431, with its one-year cumulative decline narrowing to 30.7%; it currently sits 34.0% below the window high and 61.5% above the low. Its drawdown from the high is about 9 percentage points deeper than BTC's, reflecting the continued contraction in how the market priced its application-layer cash flows this year.
Long-cycle levels. Calculated using the $3,682–$1,504 range, ETH's 61.8% retracement level is $2,337; the current price of $2,431 has reclaimed this level on volume and is approaching the 50% level of $2,594; $2,337 has turned from resistance back into support and is the short-term bull-bear dividing line. Downside support is, in order, the 61.8% level of $2,337, the 78.6% retracement level of $1,971, and the one-year low of $1,504; upside resistance is, in order, the 50% level of $2,594 and the 38.2% level of $2,851. Having held $2,337, the next target is $2,594; a fresh breakdown would indicate that this recovery is still dominated by short covering.
Future drivers. First, L2 diversion of mainnet fees: L2s siphon off transaction activity, reducing mainnet burns and continuously weakening ETH's deflation narrative—the core reason for its valuation contraction. Second, staking and ETF structure: staking ETFs and a rising institutional staking ratio would lock up circulating supply, a potential positive variable. Third, RWA and stablecoin settlement share: Ethereum remains the preferred settlement layer for institutional tokenization; if RWA scaling accelerates, fees and burns will return. Fourth, the pace of technical upgrades: upgrade expectations around scalability and the consensus layer over the coming year will periodically shift market pricing.
3. SOL (High-Performance L1): High Beta Stuck Between 61.8% and 78.6%
Price review. SOL recorded its one-year window high of $171.74 on November 11, 2025, peaking slightly later than the major tokens; it recorded a one-year low of $60.14 on June 6, 2026, a maximum drawdown of 62.5%, the deepest among L1s; after the Q3 recovery it fell back below $84 in October–November, then rebounded over the following two days and now trades at $96.29, down 40.3% over the year; it currently sits 43.9% below the window high and 60.1% above the low. As a high-beta asset, SOL's volatility has consistently exceeded BTC's—more elastic on the way up and deeper on the way down, and this year was a complete illustration of that.
Long-cycle levels. Calculated using the $171.74–$60.14 range, SOL at $96.29 remains between the 61.8% retracement level of $102.77 and the 78.6% retracement level of $84.03; it has rebounded about 15% from the 78.6% level low but is still 6.7% from the 61.8% level. Downside support is, in order, the 78.6% level of $84.03 and the one-year low of $60.14; upside resistance is, in order, the 61.8% level of $102.77, the 50% level of $115.94, and the 38.2% level of $129.11. $84 withstood the test of a double bottom and is the bulls' last line of defense; reclaiming $102.8 would reopen room for recovery.
Future drivers. First, validator clients and performance: progress on next-generation clients such as Firedancer determines network stability and throughput ceilings, a prerequisite for institutional capital entry. Second, on-chain trading activity: MEME trading and DEX share are the main sources of SOL fees, and their activity cycle maps directly to price elasticity. Third, spot ETF progress: the approval and inflow pace of a U.S. SOL spot ETF is the most important incremental variable for 2026. Fourth, the competitive narrative with ETH: where developers and liquidity migrate in the L1 arms race determines the long-term valuation anchor.
4. BNB (Exchange Platform Token): The Shallowest Drop Among Major Tokens, the Cash-Flow Resilience of Platform Tokens
Price review. BNB recorded its one-year window high of $1,018 on November 10, 2025, and its one-year low of $537.5 on July 1, 2026, the same day as BTC, a maximum drawdown of 45.1%; after the Q3 recovery it pulled back in October–November, then rebounded with the market and now trades at $720, down 24.2% over the year; it currently sits 29.3% below the window high and 33.9% above the low. Among the ten tokens, BNB's one-year decline and maximum drawdown are second only to BTC's, with markedly better resilience than other public-chain assets—platform tokens are underpinned by real, stable exchange cash flows, giving them defensive qualities during liquidity contractions.
Long-cycle levels. Calculated using the $1,018–$537.5 range, BNB's 78.6% retracement level is $640; the current price of $720 not only holds above the 78.6% level but sits precisely at the edge of the 61.8% retracement level of $721.13—another precise long-cycle level hit following BTC, a better position than XRP and DOGE. Downside support is, in order, the 78.6% level of $640 and the one-year low of $537.5; upside resistance is, in order, the 50% level of $778 and the 38.2% level of $835. Holding or losing $721 is the first short-term hurdle: holding it would confirm the reclaim of the 61.8% level, and a move above $778 would enter the main advance of the recovery.
Future drivers. First, exchange business momentum: spot and futures trading volume and new user growth directly determine platform revenue and the intensity of buyback-and-burn; quarterly burn amounts are the hardest pricing anchor. Second, on-chain ecosystem: DEX trading volume and MEME ecosystem activity on BNB Chain determine on-chain demand. Third, the regulatory environment: compliance costs and licensing progress for leading exchanges affect risk premiums. Fourth, marginal changes to the burn mechanism: any adjustment to burn pace or rules would directly alter the supply curve.
5. XRP (Cross-Border Payments): Falling Below the 78.6% Level, the Latecomer Whose Low Came Last
Price review. XRP recorded its one-year window high of $2.58 on November 11, 2025; unlike most assets, its one-year low did not occur in mid-2026 but on August 15 at $0.984—its second leg down came two months later than the major tokens, with a maximum drawdown of 60.4%; after rebounding above $1.6 in Q3 it weakened again, then rebounded with the market on November 4 and now trades at $1.31, down 42.6% over the year; it currently sits 49.3% below the window high and 33.0% above the low. Its low coming last means XRP's clearing rhythm was independent of the broad market, with its pricing driven more by its own events than by BTC.
Long-cycle levels. Calculated using the $2.58–$0.984 range, XRP's 78.6% retracement level is $1.33; the current price of $1.31 is retesting this level from below—less than 2% away from reclaiming it, but it remains one of the weakest-positioned assets among the ten. Downside support is, in order, the short-term cost zone around $1.27 and the one-year low of $0.984; upside resistance is, in order, the 78.6% level of $1.33, the 61.8% level of $1.59, the 50% level of $1.78, and the 38.2% level of $1.97. Holding or losing $1.33 is the short-term dividing line: reclaiming it would confirm the start of a recovery, while the $1 round-number mark and the one-year low form a double psychological defense line.
Future drivers. First, cross-border payment adoption: the scale of settlement partnerships with traditional banks and the stablecoin share of cross-border channels determine the speed of its transformation from a narrative asset to a cash-flow asset. Second, ETF progress: the approval of an XRP spot ETF and post-listing inflows are the most direct event variables for 2026. Third, institutional allocation after regulatory clarity: the pace of compliance dividend release following the end of litigation is still materializing slowly. Fourth, competitive dynamics with stablecoins: the cross-border payments market is also being eroded by stablecoins, and XRP needs to prove it is faster and cheaper than dollar stablecoins.
6. DOGE (Meme Culture): One Step from the One-Year Low, a Case Study in Meme Clearing
Price review. DOGE recorded its one-year window high of $0.186 on November 11, 2025, and its one-year low of $0.0677 on August 2, 2026, a maximum drawdown of 61.4%; it now trades at $0.0772, down 52.9% over the year, still the weakest of the ten tokens—currently 58.5