Goldman Sachs: Seven "Repair" Signals Emerge in US Stocks, but Investors Must First Survive 2026


- Core View: Goldman Sachs strategists believe that after October's sharp swings in US stocks, multiple contrarian indicators have emerged — including hedge fund net exposure, abnormal market breadth, and overvalued defensive stocks — suggesting that positioning levels support a recovery. However, capital deleveraging is not yet complete, and the real test lies in 2026.
- Key Elements:
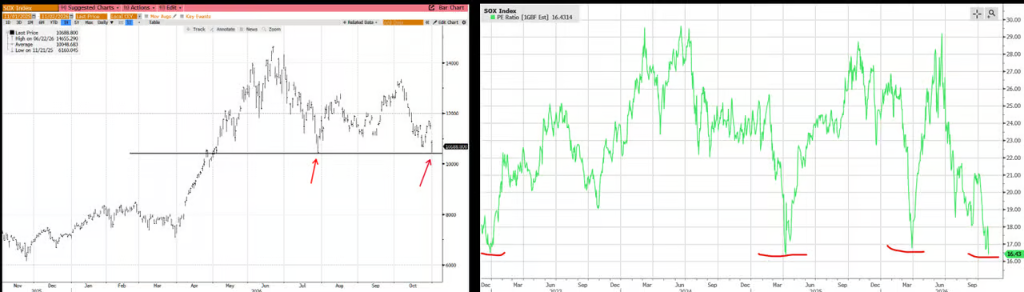
- The Nasdaq 100 fell about 7% in October, its second-worst month since the AI rally began; the Philadelphia Semiconductor Index broke below its 200-day moving average, ending a 355-trading-day streak, with forward P/E dropping to around 16x — a cycle low for the AI era.
- Hedge funds' US fundamental long/short net leverage fell to 47% (7th percentile over the past year). Historically, this level has often corresponded to drawdowns exceeding 20%, yet the S&P 500 is only about 3% below its highs — a contrarian divergence.
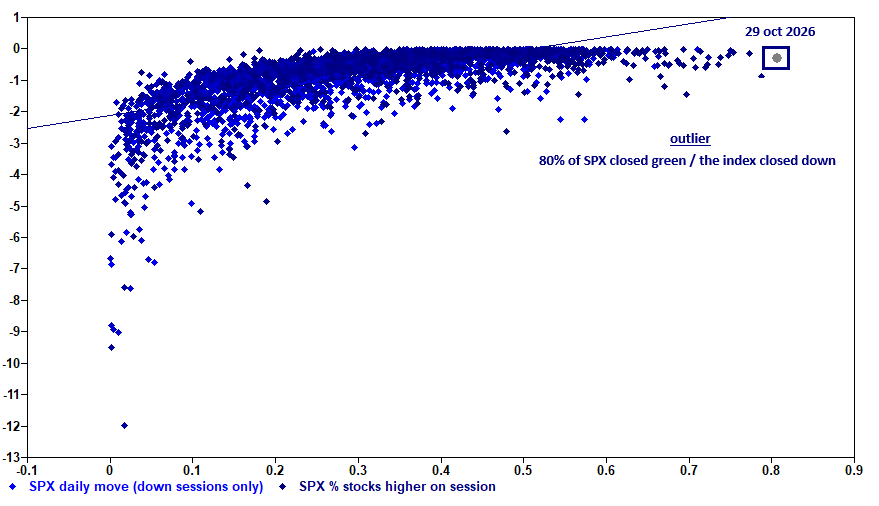
- On one trading day, 80% of S&P 500 constituents rose while the index closed lower — a historical anomaly. The S&P 500 excluding AI names is on track for its best month since 2022, highlighting the persistent divergence between AI and non-AI stocks.
- Defensive assets are richly valued: the dividend yield factor sits at the 90th percentile over ten years, the valuation factor at the 80th percentile, and low-volatility index forward valuations have expanded to growth-stock levels; Apple's forward P/E of 36x marks a record valuation high.
- Index implied volatility has caught up, with the VVIX touching 124 intraday and single-day options volume nearing 100 million contracts — the fourth-highest on record — yet 0DTE straddle pricing has not reacted noticeably, and Gamma remains stable.
- Hedge funds were net buyers of US stocks for the first time in four weeks, but 73% was macro products and primarily short covering; tech buying was only equivalent to 40% of the prior three weeks' selling, and Mag 7 longs remain near year-to-date highs.
- Retail behavior has shifted from "unconditional buy-the-dip" to "ask first, then buy"; credit markets suggest AI financing demand may be lower than expected; options markets have priced 2027 intra-index correlation to a historical low of around 20%.
Original author: Xu Chao
Original source: Wallstreetcn
US stocks closed October with a bout of sharp turbulence. Goldman Sachs derivatives strategist Brian Garrett, in his latest weekly report, identified seven market "repair" signals, arguing that current positioning and sentiment have released a contrarian buying basis—though he also conceded that the real test is not over yet: "We just need to survive 2026 first."
The Nasdaq 100 fell about 7% in October, the second-worst month since the AI rally began in 2023, and slid into its third correction of the year. Chip stocks plunged 7% to 8% on Friday alone, marking the third-largest single-day relative decline in over 15 years; the Philadelphia Semiconductor Index, after holding above its 200-day moving average for 355 consecutive trading days, broke below that line on Friday and is now testing its July low. The S&P 500 fell 0.6% for the week, closing at 7,580.
But Garrett noted that despite persistent pressure on spot prices, "some contrarian indicators are emerging, suggesting the current move may have certain repair characteristics." Goldman Sachs Prime Brokerage data shows that hedge fund net exposure levels are historically typically associated with drawdowns exceeding 20%, while the S&P 500 is currently only about 3% off its all-time high—this divergence itself constitutes a contrarian signal.
Chip Stocks' 355-Day Record Ends, Valuations Return to AI Cycle Lows
Goldman Sachs TMT specialist Peter Callahan noted that the Philadelphia Semiconductor Index closed below its 200-day moving average on Friday, ending a 355-trading-day streak above the line—the third-longest such run in the past 10 years—and is now retesting its July low. The semiconductor sector's forward P/E has fallen to about 16x, hitting the valuation low of this AI cycle.
What triggered this selloff was a dense week of earnings—Callahan believes the relevant data points "to some extent show characteristics of a growth inflection point," but he stressed that these signals "all come from outside the AI core complex," citing Amazon's guidance on AWS revenue visibility for the next two years as supporting evidence.
The next day's reaction was even more violent: NOW fell 25% in a single day, INTC dropped 30%, RDDT fell 30%, FFIV declined 20%, with multiple stocks posting their worst post-earnings performance on record. Callahan attributed the cause to crowded positioning, a compressed earnings calendar, and persistent structural debates within the industry.
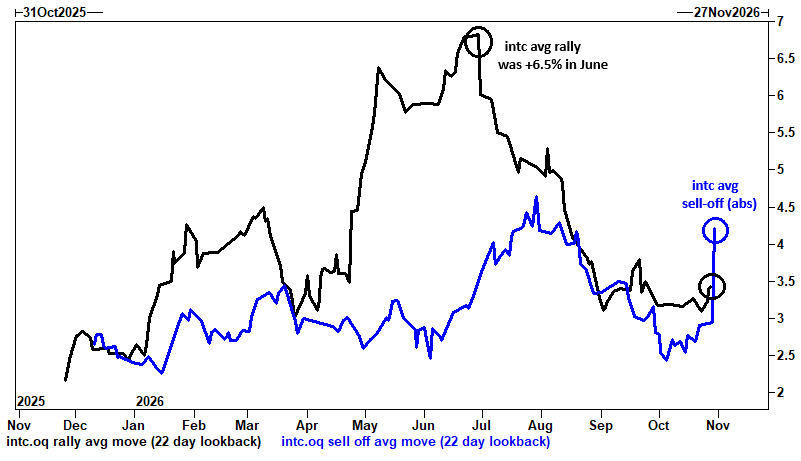
Garrett further pointed out that the direction of market volatility has flipped—stocks "no longer melt up." Take Intel as an example: in June of this year, its average daily gain reached 6.5%, while its current average daily decline has exceeded its average gain. Both the semiconductor ETF and QQQ show the same pattern: average amplitude on down days is again larger than on up days. In Garrett's words, stocks are "behaving like stocks again—downside volatility is more extreme than upside volatility."
Index Volatility Catches Up, but Gamma Remains Unmoved
The first contrarian signal Garrett lists is: at the macro level, equity implied volatility has finally begun to "catch up," closing the gap with single-stock volatility and credit markets that had already fully priced in panic.
Goldman Sachs derivatives team's weekly report shows that the Nasdaq 100 one-month implied volatility surged nearly 2 volatility units in a single trading day, with clients for the first time chasing index downside protection and showing flow changes in semiconductor sector puts, while the S&P 500 briefly broke below the medium-term CTA (trend-following strategy) threshold intraday. The deviation of QQQ realized volatility relative to implied volatility was one of the most significant single events in the past year.
Volatility of volatility also spiked in tandem: VVIX touched an intraday high of 124, the highest level since a specific geopolitical conflict broke out, before pulling back somewhat. US equity options volume on Friday approached 100 million contracts in a single day, the fourth-highest reading on record.
The only thing that didn't budge was Gamma. Garrett noted that "despite the sizable single-day realized moves in the index, 0DTE straddle pricing never showed a significant reaction." Taking the S&P 500 as an example, the cost of a straddle covering both Apple earnings and the midterm elections was only 150 basis points—lower than the 180 basis points of actual decline on Friday alone. For year-end directional implied volatility, the S&P 500 stood at ±5.1%, the Nasdaq 100 at ±7.8%, and the Russell 2000 at ±6.3%, with large-cap volatility once again higher than small-cap.
Hedge Fund Net Exposure Hits "Bear Market Levels," but the Index Hasn't Fallen
The second contrarian signal comes from Goldman Sachs Prime Brokerage data: hedge funds net bought US equities for the first time in four weeks (+1.1 standard deviations), but 73% of the buying came from macro products and was primarily short covering—US-listed ETF short positions fell 4.8%, the largest single-week covering in over six months, led by tech, large-cap equity, and credit ETFs.
Although tech was the most net-bought sector for the week, according to Goldman Sachs Prime Brokerage team statistics, this buying (as of Thursday) was only about 40% of the selling volume over the past three weeks, and the "Magnificent Seven" (Mag 7) were net sold on four of the past five trading days, "showing almost no substantive recovery in risk appetite."
Notably, Garrett pointed out that Mag 7 remains "one of the few areas within TMT where positioning continues to accumulate," with long positions still near year-to-date highs—the market, while selling tech, is paradoxically reluctant to let go of the most concentrated holdings.
The more critical data point: US fundamental long/short net leverage fell to 47%, in the 7th percentile of the past year. After running a regression analysis of this data against S&P 500 drawdowns, Garrett found that this net exposure level is historically typically associated with drawdowns exceeding 20%—while the current index is only about 3% below its all-time high. In other words, hedge fund positioning is already preparing for a "bear market that hasn't happened yet," which precisely constitutes the basis for contrarian bullishness.
80% of Constituents Rose, yet the Index Closed Lower: "Defensive Stocks Are Expensive"
The fourth and fifth signals come from market internals. On Thursday, 406 S&P 500 constituents closed higher, one of the highest proportions on record since 2026, yet the index still closed lower that day. Garrett plotted all down days against the proportion of stocks that rose that day on a scatter chart, and Thursday's data point stood isolated—80% of constituents rising while the index fell is almost unprecedented in history.
Behind this is the persistent rift between AI and non-AI stocks: the Goldman Sachs AI Winners basket remains under pressure, while the S&P 500 excluding the AI sector (S&P ex-AI) is on track for its best monthly performance since 2022. Meanwhile, US Treasuries (TLT) and the AI Winners basket show a two-week correlation of about -0.7, near the low end of the past two years, presenting the classic risk-off pattern of "AI falls, bonds rise."
On valuations, the S&P 500 is up 10.7% year-to-date, but its forward P/E has fallen to the lowest level of 2026, at about 19x—the index rising while valuations "catch down" to earnings constitutes a contrarian signal. However, "defensives are already expensive": the dividend yield factor is in the 90th percentile of the past 10 years, the valuation factor in the 80th percentile; while the momentum factor is only in the 30th percentile and the growth factor in the 40th percentile. The forward valuation multiple of the low-volatility index has expanded to growth-stock levels.
Callahan wrote that conversations about "broadening the portfolio" are increasing, but "easier said than done"—trading days led by non-AI sectors often give people the uneasy feeling of "positions being dismantled," and it's hard to find genuine non-AI names unaffected by the AI disruption narrative. He listed stocks that are currently working, including: AAPL, SNPS, ADI/TXN/NXPI, SPOT, V/MA, EBAY, and LYV.
Apple Hits Record Valuation High, Midterm Elections Priced at a Discount
This week's market catalysts are highly concentrated: Apple (AAPL) reports after the close on Monday, AMD and ANET report on Tuesday, the midterm elections on Tuesday (Kalshi predicts a 65% probability of a Democratic sweep), Treasury refunding details (QRA) on Wednesday, and nonfarm payrolls on Friday (+29K last month). The S&P 500's implied move for the week is 1.84%.
Callahan focused on five stocks. Apple, at 36x forward P/E, hit an all-time absolute valuation high, a 17x premium to the S&P 500—a record relative valuation. This last mega-cap still regarded as a safe-haven asset is also the most expensive ever, confirming the "defensives are expensive" logic.
On the midterm elections, Garrett expects they "won't constitute an event" for the index overall, but believes it's a moment for thematic basket strategies to shine. He named the pair trade most worth watching: long renewable energy and grid-related names, while buying downside protection in hyperscale data center and data center equipment sectors—"who pays for data center electricity" he considers the "most underappreciated election-sensitive theme" in US equities.
The Final Two Signals: AI Financing Expectations Reverse, Retail Starts "Asking Before Buying"
Garrett's last two contrarian signals are softer. Number six: credit market experts are beginning to suggest that AI financing demand may be lower than expected; if hyperscalers' reliance on the bond market weakens, it would help ease market anxiety, but "it will take time to materialize."
The seventh, and the one Garrett finds most amusing: the behavior of his college classmates and father-in-law has begun to flash warning signals—this group has gone "from unconditionally buying the dip to at least asking a question before buying." Garrett believes retail investors are on "the eve of an agentic transformation," citing an advertisement as an example: in between the kids going out trick-or-treating, the ad promises "set up your agentic options strategy in 7 minutes."
Taken together, Garrett believes positioning-level signals support a repair: net exposure already corresponds to historical drawdowns of over 20%, panic-driven market breadth anomalies have appeared, defensive stock valuations are severely overstretched, and retail sentiment is showing cracks. But fund flows indicate deleveraging is far from over: trading desks are still selling tech stocks, Mag 7 long positions remain near year-to-date highs, the CTA system is about to trigger a new round of short signals, and the options market's pricing of the combined Apple earnings and midterm elections event is even lower than Friday's single-day actual volatility cost. As for 2027, the options market has priced index internal correlation at a historic low of about 20%—by then the index may stand still while the internals remain in turmoil.