




What's driving Bitcoin's surge? Is it just bad news being priced out?


- Core View: After the Fed's rate hike landed, the crypto market staged a strong rebound, with BTC breaking above $84,000 and total market cap returning above $2.9 trillion. BTC closed above its 50-week moving average for the first time, confirming a bull market signal, but the cloud of a second rate hike and uncertainty surrounding the CLARITY Act remain.
- Key Factors:
- BTC rebounded more than 12% from its low of $74,968 on the day of the rate hike, breaking above $84,000; total market cap returned above $2.9 trillion.
- BTC closed above its 50-week moving average for the first time in 45 weeks. Galaxy research shows that in 13 historical instances of reclaiming this moving average, 11 did not see a new low afterward.
- Offshore markets continued to accumulate, Binance CVD recovered from lows, and long-term holders slowed their selling pace from 105,900 BTC to 21,700 BTC.
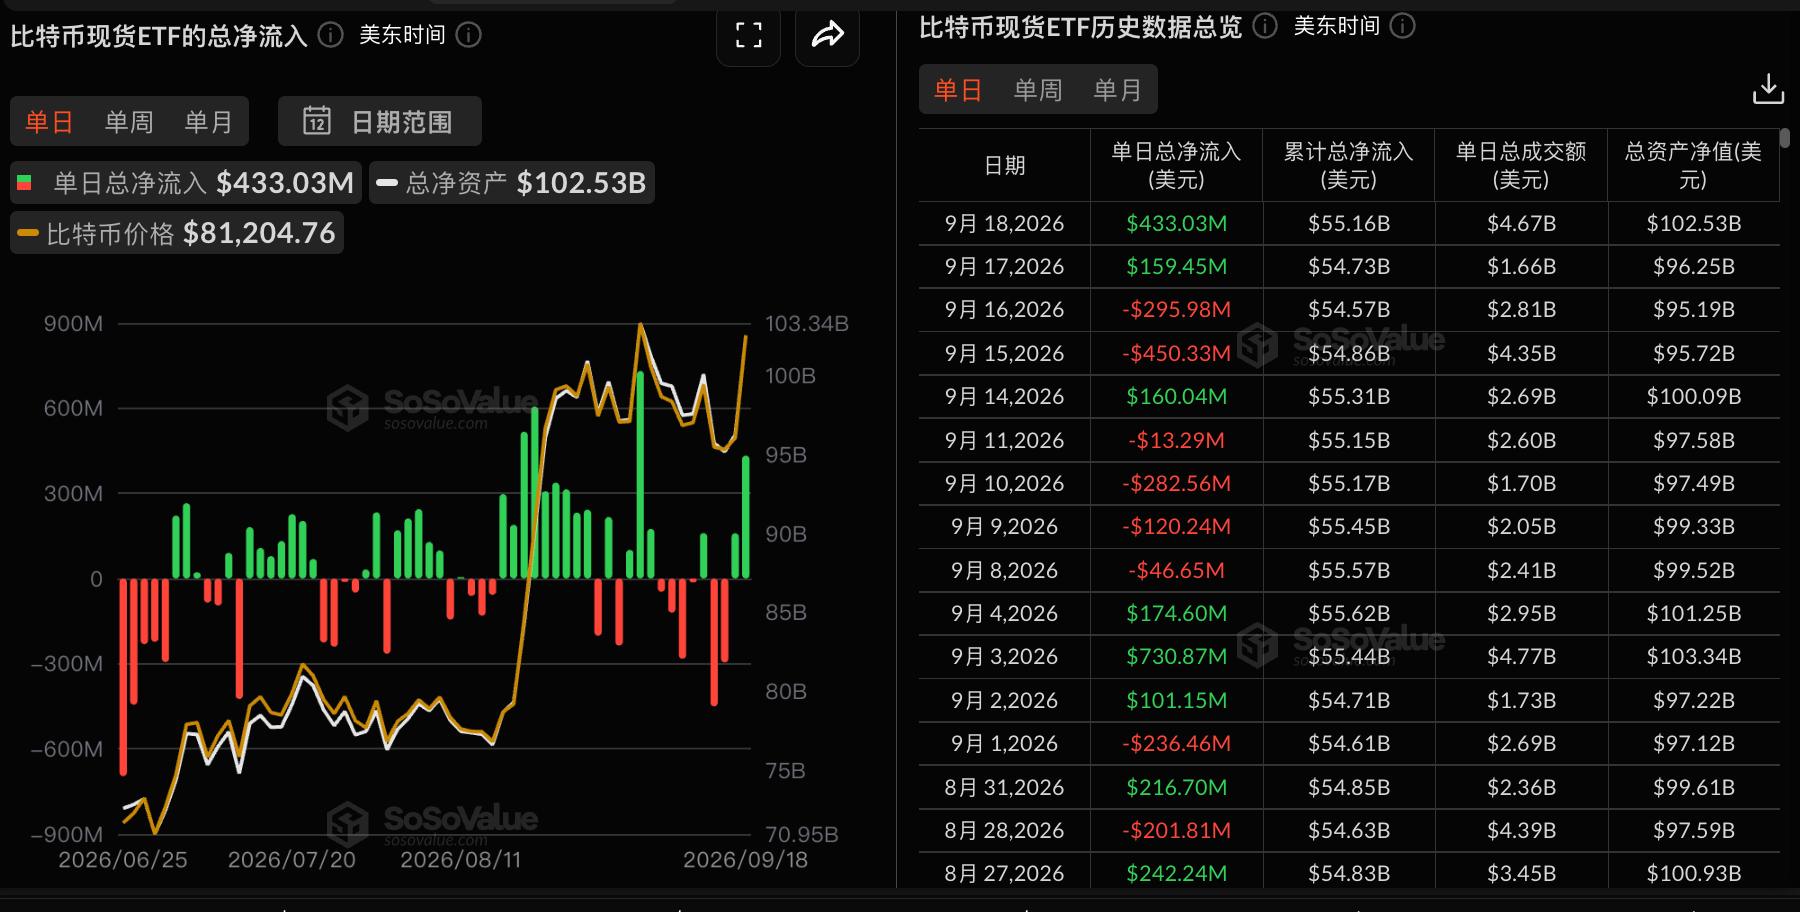
- Cumulative net inflows into spot BTC ETFs surpassed $55 billion, with total net asset value share nearing 6.3% and single-day inflows reaching as high as $433 million.
- The U.S. SEC introduced an innovation exemption policy allowing the trading of tokenized stocks, and the CFTC submitted a new draft of crypto trading rules to the White House, with policy tailwinds continuing.
- Analysts believe that after an effective breakout above $82,000, BTC could march toward $100,000, while ETH may test $2,700–$3,000.
Original|Odaily (@OdailyChina)
Author|Wenser (@wenser 2010)

Following the Fed's rate hike and the postponement of the CLARITY Act, the crypto market has returned to a bull market, buoyed by positive developments such as the U.S. SEC's innovation exemption policy.
The total cryptocurrency market capitalization briefly reclaimed the $2.9 trillion mark, coming within striking distance of $3 trillion. BTC briefly broke through $84,000 today, up over 12% from the brief dip below $75,000 on the rate hike day of September 16; ETH briefly broke through $2,700 and is currently at $2,690; SOL has been oscillating around $110 and is currently trading at around $115.
For a time, bullish voices dominated the market. On the other hand, however, with the shadow of a second Fed rate hike still looming, the fate of the CLARITY Act still uncertain, and global central banks following suit with rate hikes, many investors have opted to take profits, and many whales are still holding short positions.
What changes have occurred in market liquidity? Can policy tailwinds be sustained? Odaily will review the main market outlooks in this article for readers' reference.
A Comprehensive Look at the Rate Hike's Impact: Market Emerges from Rate Hike Pressure, But Awaits More Catalysts
The Federal Reserve raised rates by 25 basis points on September 16, lifting the federal funds rate target range to 3.75%–4.00%. The market expects further rate hikes of up to 75 basis points over the next 6 months.
Bitcoin has pulled back about 40% from its high of approximately $126,000 last October, similar to the 40% decline from its November 2021 high of about $69,000 when rates were first hiked in March 2022. After the March 2022 rate hike, Bitcoin rallied about 18% within 12 days before falling a further 50%.
Grayscale: This Round of Fed Rate Hikes Has Limited Impact, Unlikely to Cause Major Changes in Crypto Market
Digital asset management firm Grayscale stated in an analysis published on September 17 that the latest Federal Reserve rate hike is more akin to a "mid-cycle adjustment" rather than a major monetary policy shift. The firm believes that this round of rate hikes, and a possible second hike within the year, are unlikely to cause major changes in the digital asset market.
Grayscale noted that from March 2022 to July 2023, the Fed cumulatively raised rates by 525 basis points, with sustained tightening raising returns on cash and interest-bearing assets and increasing the opportunity cost of holding Bitcoin. The current environment, by contrast, represents a single rate hike following years of hikes, cuts, and pauses.
Grayscale stated that the impact of rate hikes will vary by crypto business model. Stablecoin issuers could benefit from increased interest income on reserve assets, and higher yields on tokenized bonds and money market funds could also attract capital inflows into on-chain financial products.
Trading Side: Offshore Markets Continue Accumulating, Exchange Selling Pressure Slows
On September 16, after the Fed rate hike was announced, Bitcoin analyst Willy Woo posted that following the failure of the CLARITY Act's Senate procedural vote, cumulative volume delta across exchanges showed: Coinbase's CVD accelerated downward to approximately negative 6,659 BTC, reflecting U.S. investor selling; Binance's CVD recovered from lows to approximately negative 5,841 BTC.
He believes that the more dominant offshore market is still accumulating, and characterized this divergence as bullish. During the same period, Bitcoin fell from a high of $80,560, dipping to $74,968; Bybit, OKX, and Bitstamp's CVD stood at approximately negative 582, negative 1,135, and negative 764 BTC respectively.
According to crypto KOL Phyrex, citing Glassnode's exchange BTC net flow data, exchange BTC net inflows have recently exceeded net outflows, and this has persisted for a considerable period.
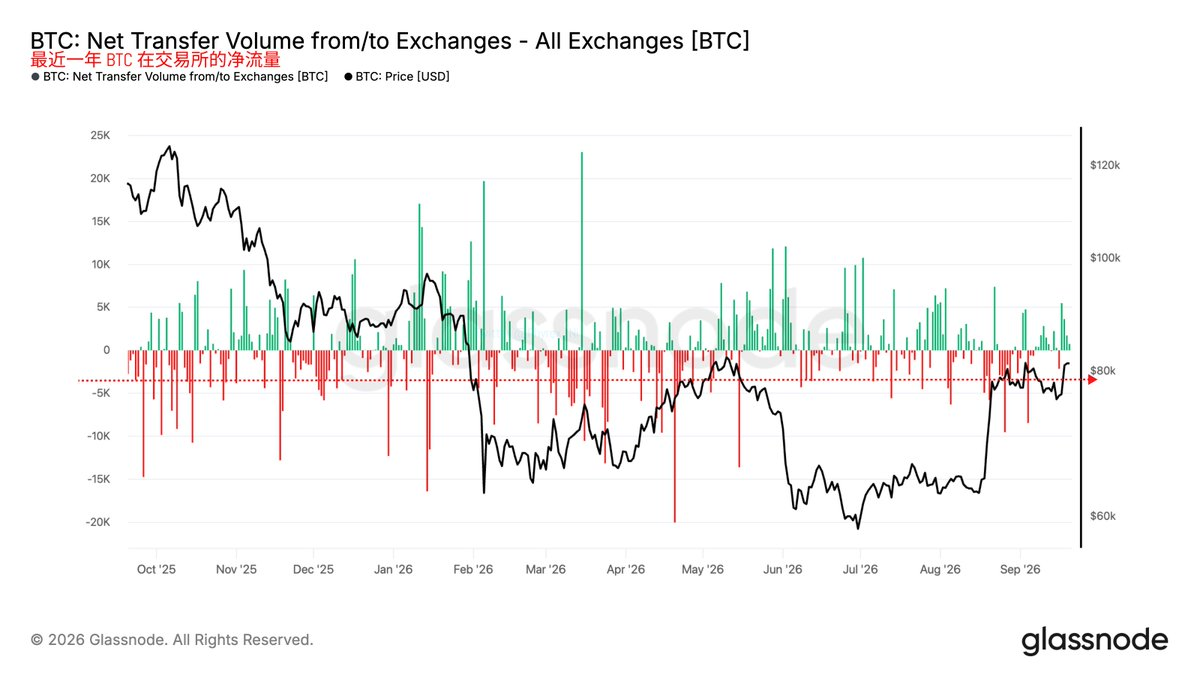
The market's strong rebound in recent days corroborates the reliability of this data, and the overall market remains a buyer's market.
Additionally, the selling pace of long-term holders has slowed significantly compared to August. Crypto analyst AxelAdlerJr monitored that Bitcoin long-term holders' holdings have been continuously declining for nearly 5 weeks; however, the rate of reduction over the past 30 days has slowed from 105,900 BTC on August 30 to 21,700 BTC on September 20. In other words, long-term holders are still reducing their positions, but at only about one-fifth the pace of late August.
K-Line Chart: BTC Price Breaks Above 50-Week Moving Average for First Time, Confirming Bull Market Onset
As of the week ending September 20, Bitcoin closed above its 50-week moving average for the first time in 45 weeks. Galaxy Research head Alex Thorn described this as a potentially important confirmation that the market's bearish phase may have ended and a new uptrend is imminent.
BTC gained nearly 6% last week, trading at around $81,000, extending its rebound over the past 35 days to 29%. This move pushed Bitcoin's weekly candle chart—the graphical representation of a week's price action—above the 50-week moving average, rather than merely touching it.
Galaxy views the BTC 50-week moving average as a ceiling during major BTC corrections. Once crypto falls below this level, historical attempts to reclaim it typically fail until the market approaches a durable bottom.
Galaxy studied Bitcoin's major drawdowns since 2011 and found that Bitcoin closed back above its 50-week moving average 13 times within a week. In 11 of those 13 instances, the market did not make a new low, indicating that the worst phase of the decline had passed.
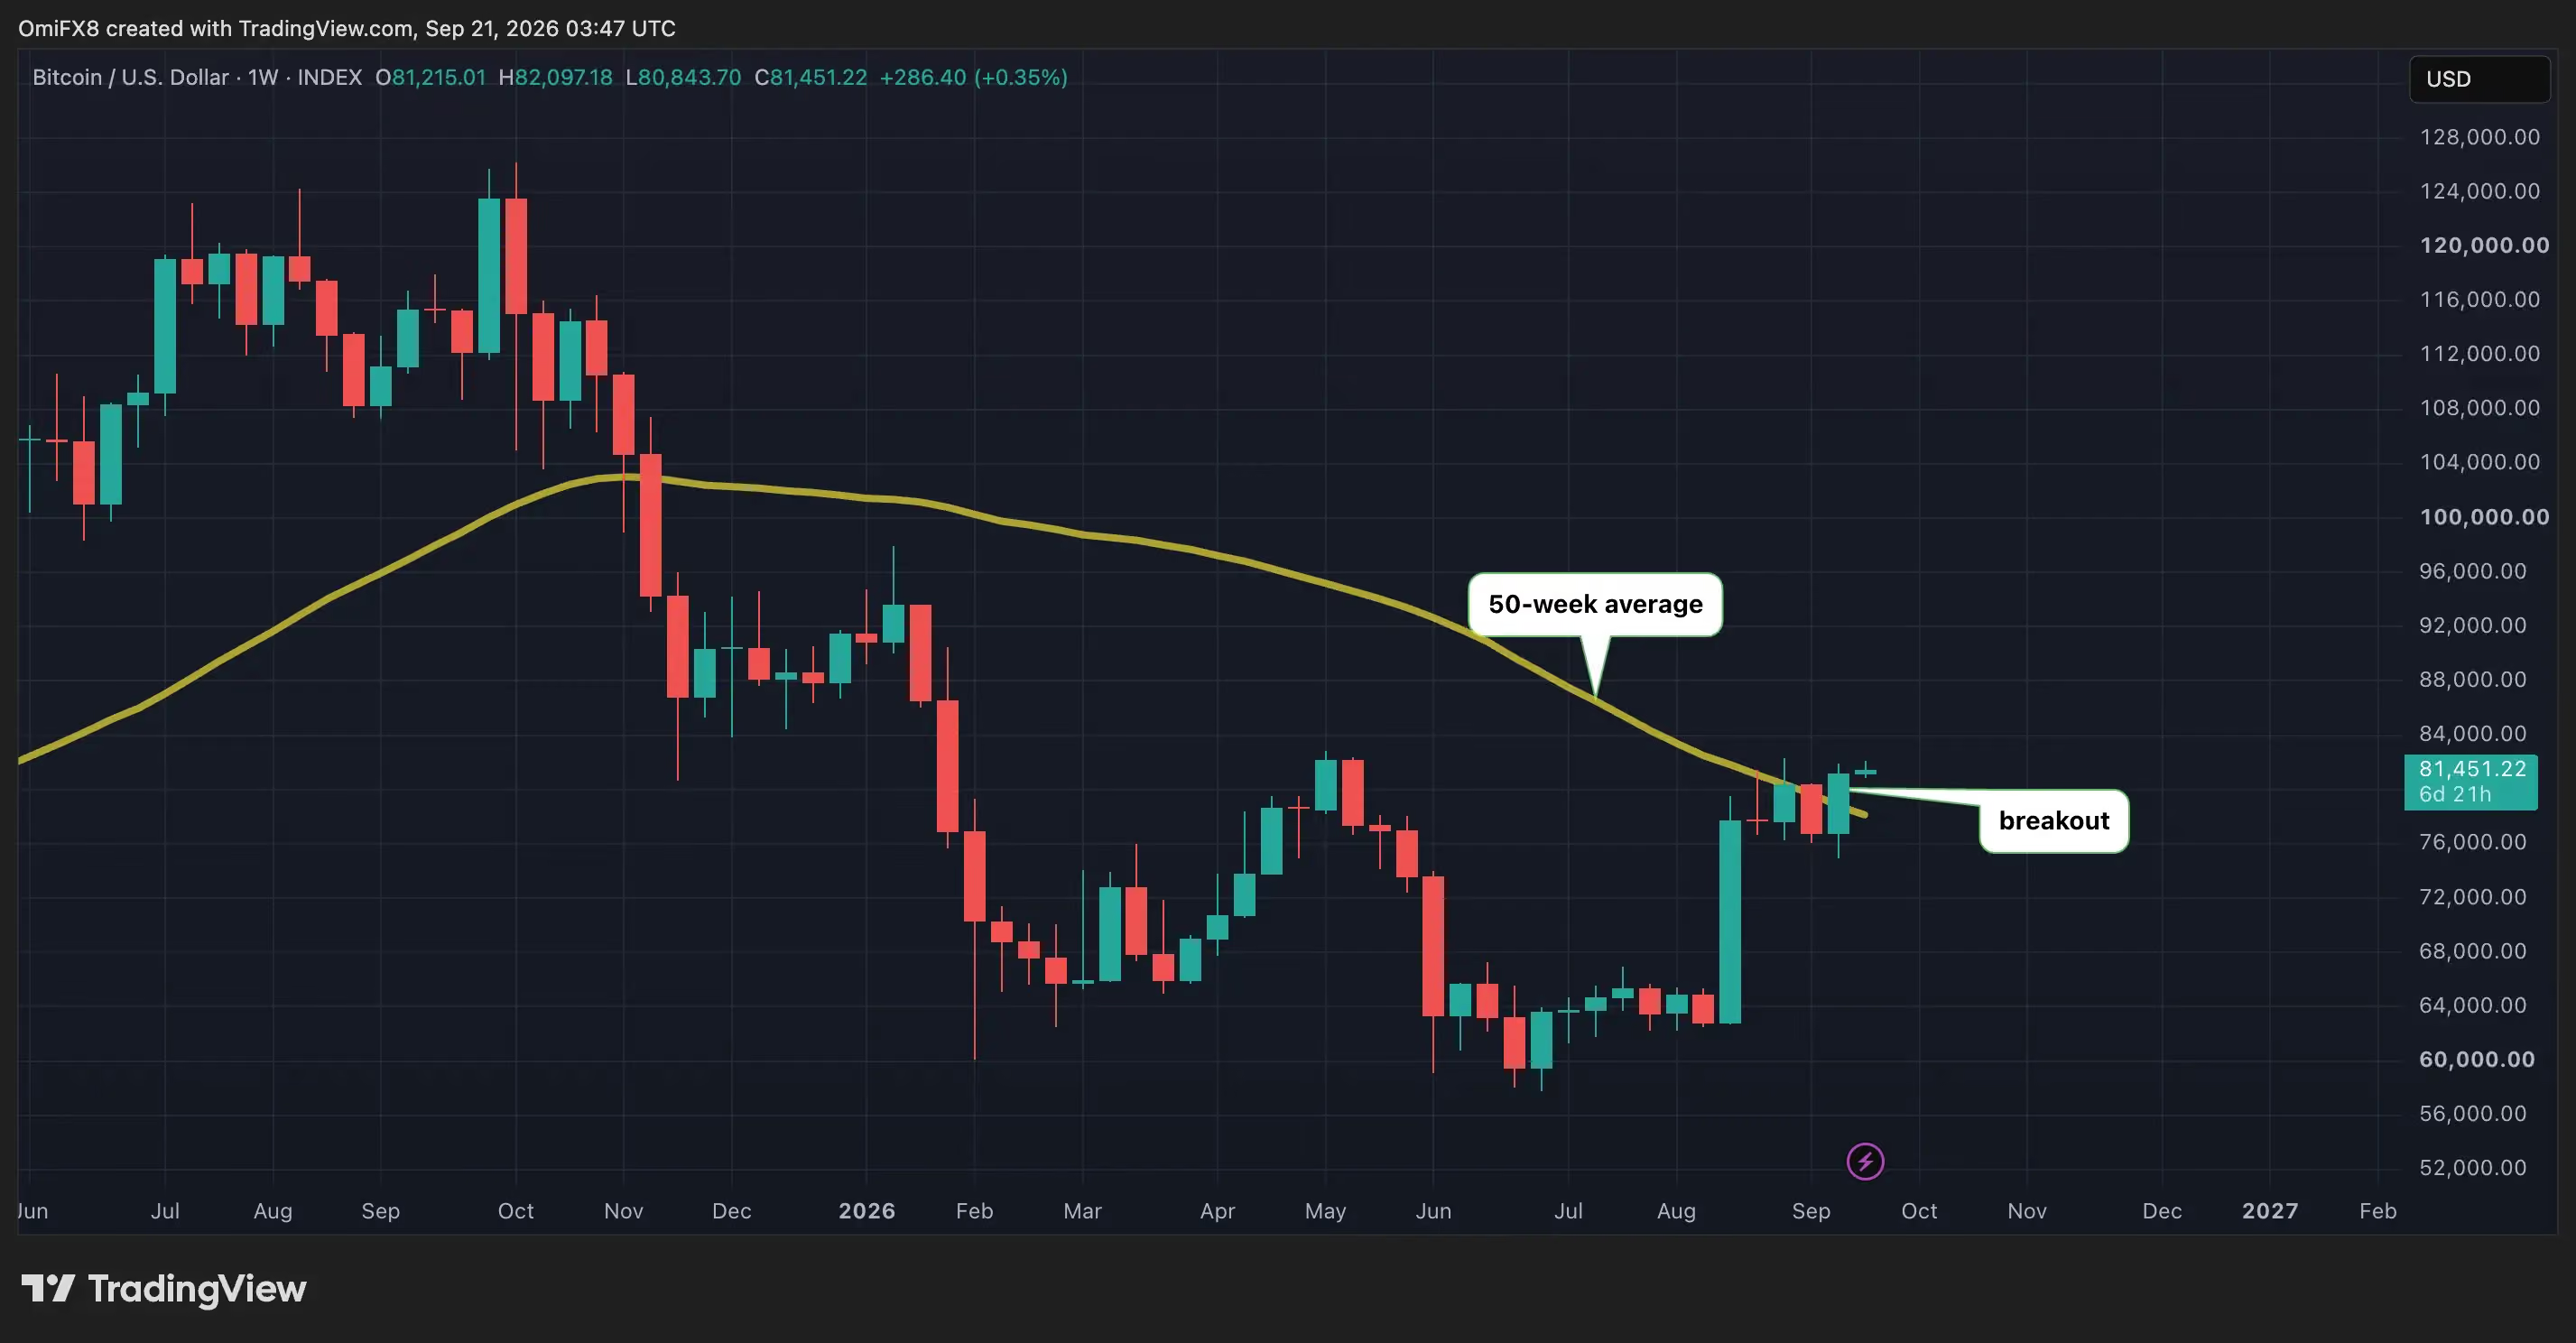
On the evening of September 20, crypto analyst Doctor Profit also posted that Bitcoin has broken above its 50-week moving average at approximately $78,700. Last week's close held above this average, which he views as a confirmation signal for the start of a new bull market.
He believes the current BTC price action is similar to the 2022–2023 structure, where Bitcoin reclaimed its 50-week moving average after weeks of resistance and a bear trap. Historically, Bitcoin has reclaimed its 50-week moving average after breaking below it 7 times, with 5 of those leading to bull markets and the other 2 forming false breakouts in 2011 and 2020 respectively; Bitcoin is currently still in the $71,000–$82,000 range, and a breakout above the $82,500–$83,000 zone would constitute a stronger confirmation. He will continue holding spot positions and targeting $88,000 after the remaining resistance is broken.
ETF Data Steady with Progress: Cumulative Total Net Inflows Surpass $55 Billion, Total NAV Share Nears 6.3%
From the perspective of institutional capital inflows, recent inflow data for BTC spot ETFs is also gradually stabilizing and improving.
On September 17, ETF-related fund products attracted $159 million in net inflows; on September 18, this figure jumped to approximately $433 million. As of September 18, BTC spot ETFs' cumulative total net inflows surpassed $55 billion, with total net asset value share nearing 6.3%.
Bloomberg ETF analyst Eric Balchunas also noted that Bitcoin investors are generally younger, while gold investors are older. As volatility and correlation with other assets stabilize, Bitcoin will see greater adoption by large institutional capital; meanwhile, Bitcoin ETFs enjoy higher market attention and sales promotion capabilities, with dozens of wholesale institutions familiar with both crypto and traditional investor markets educating investors about Bitcoin ETFs.
From a temporal perspective, history is on BTC's side, and younger generations as well as institutions will be BTC's best allies.
CLARITY Impact Fades, U.S. SEC and CFTC Policy Tailwinds May Continue to Benefit Crypto Market
On September 17, the day after the CLARITY Act failed to pass a Senate vote, the U.S. SEC introduced an innovation exemption policy allowing tokenized stocks to be traded on crypto trading platforms through TSVs. On September 18, the U.S. CFTC submitted a draft of new rules for crypto trading and markets to the White House. Based on previous statements by SEC Chairman Paul Atkins, CFTC Chairman Michael Selig, and others, crypto-friendly rules and policies conducive to market development will continue to be issued.
Pantera Capital founder Dan Morehead said in response that the SEC and CFTC are still continuously rolling out related measures, which may in the future be incorporated into CLARITY legislation. In his view, even if the bill has not yet passed, the crypto industry can still continue to develop.
Overview of Crypto Analysis Views: BTC Breaking $82,000 Becomes Key Indicator, ETH May Test $3,000
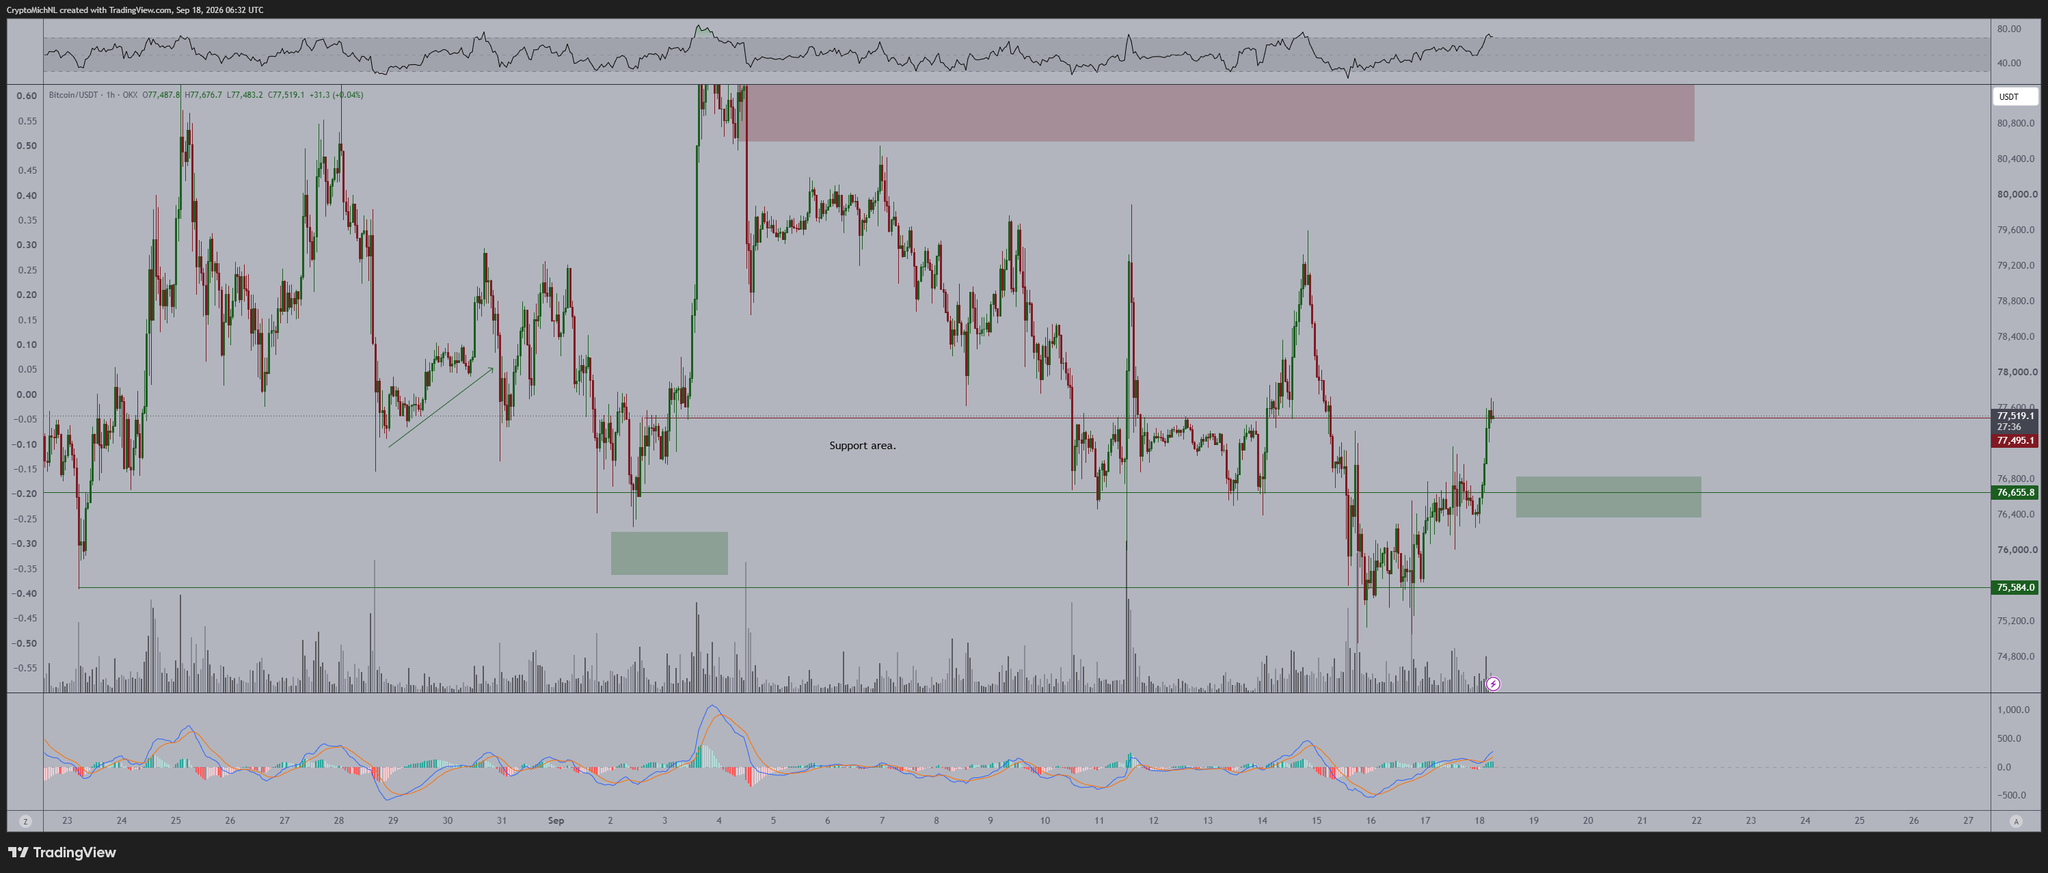
Crypto analyst Michaël van de Poppe even described the market as being in a "bullish" state before Bitcoin broke through the $80,000 mark. He considers $76,700 to be a potential support level for Bitcoin to continue its rally toward the upper end of the range. His exact words were: "Any reversal at the $76,700 level for Bitcoin is an excellent long-term entry point to reach the top of this range."
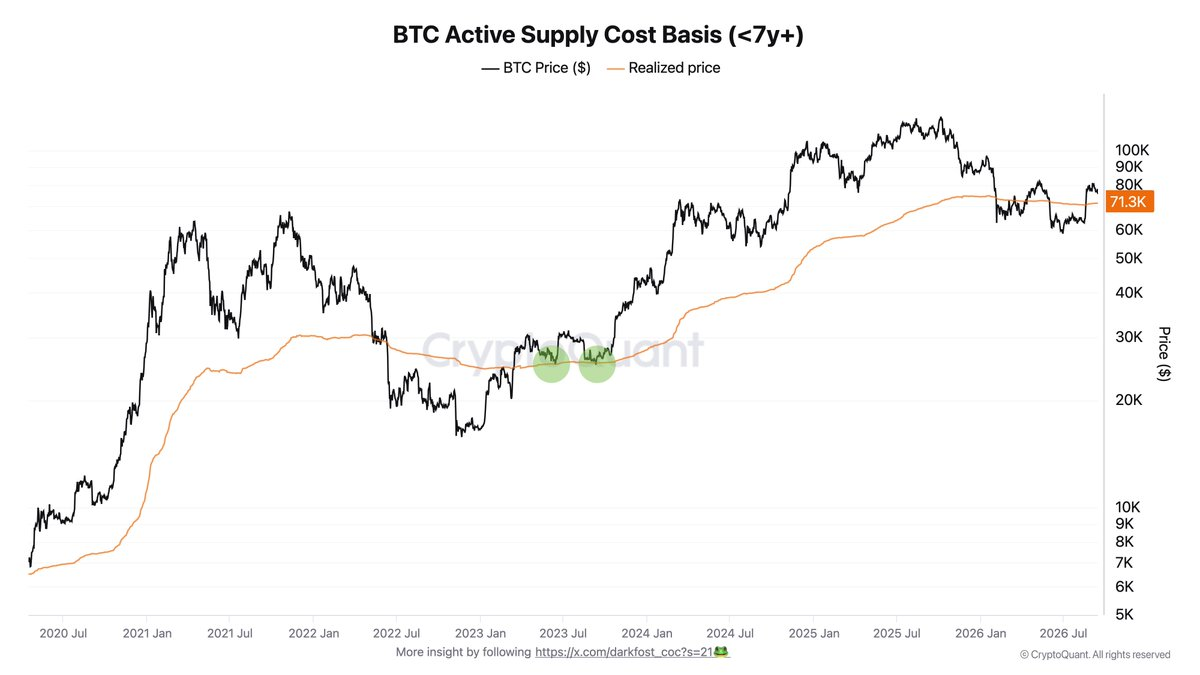
CryptoQuant analyst Darkfost identified the key BTC range of $71,300–$79,800 on September 17. He believes the lower bound of this range corresponds to the average cost of Bitcoin's active supply, which can serve as a support level. By contrast, the $79,800 level has acted as resistance multiple times as investors sell upon reaching their break-even point. On September 18, BTC successfully broke through.
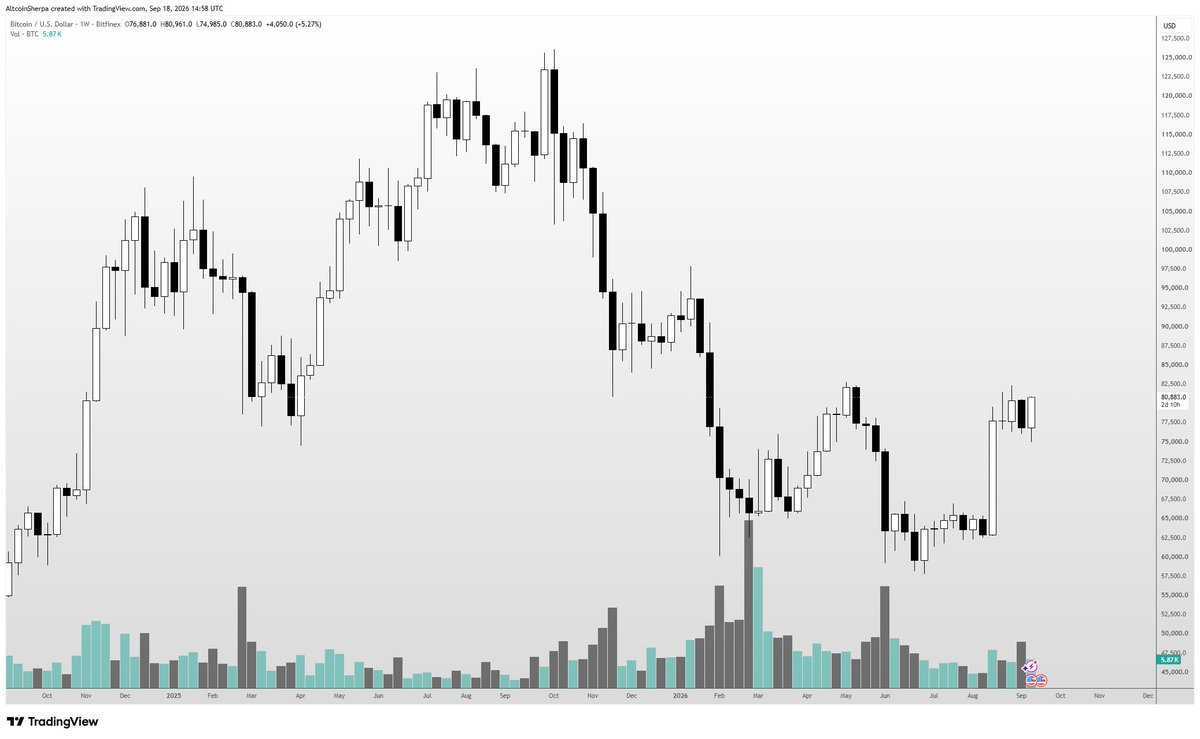
Trader Altcoin Sherpa believes the next key level is around $82,000. In his view, after an effective breakout above this level, the price could potentially head toward $100,000. Until then, he doesn't rule out continued range-bound trading.
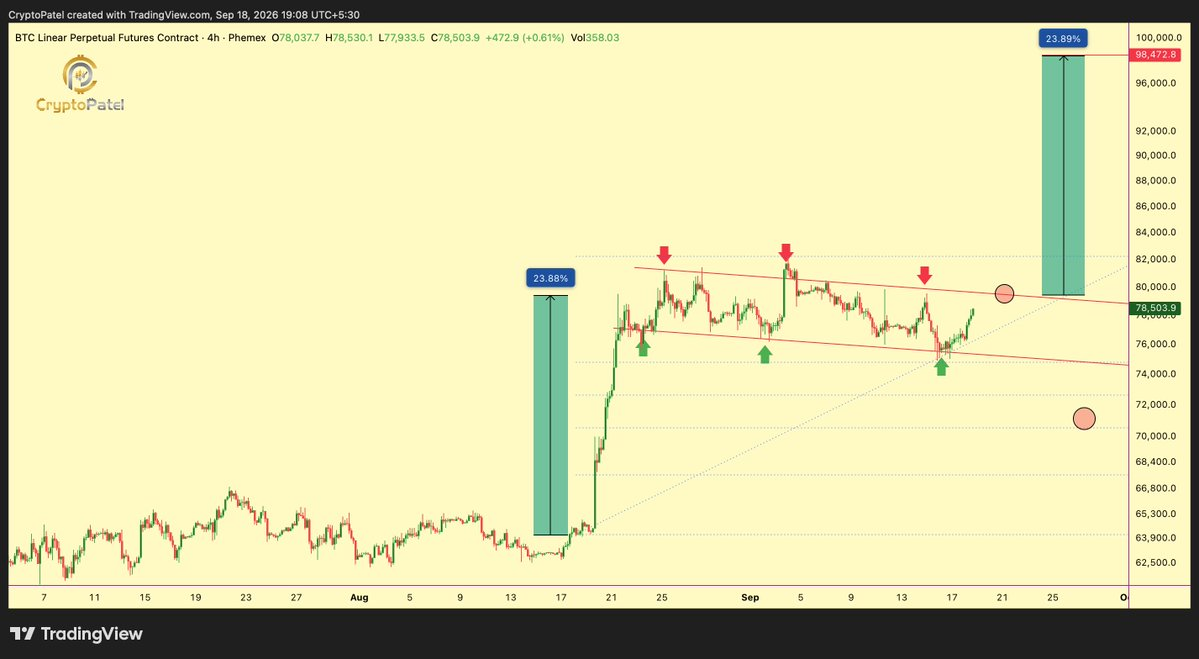
Technical analyst Crypto Patel lists $80,000 as a key level. According to his model, holding BTC above this level would confirm a "bull flag" breakout, with subsequent targets at $82,250 and $98,000.
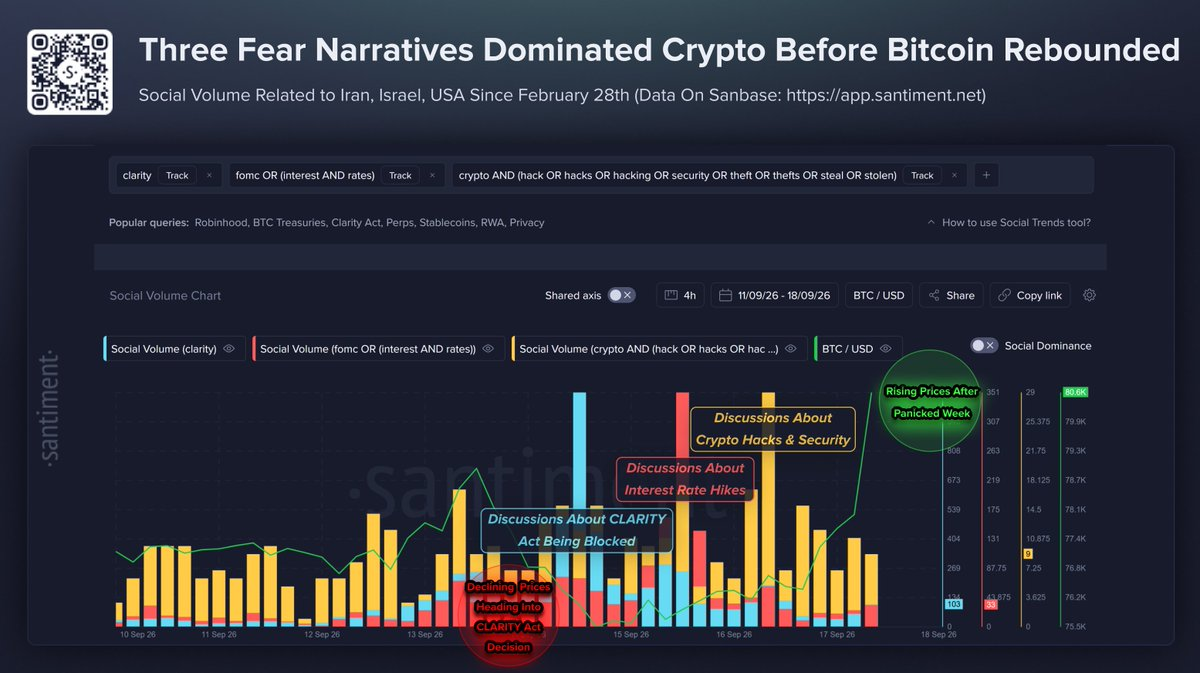
Data analytics platform Santiment also noted that last week the crypto market as a whole was in a phase of digesting "3 major crises," including the Fed rate hike, the CLARITY Act's failure to pass, and market security risk events such as Symbiosis and Revolut. Currently, the market has fully digested the related negative factors, more patient long-term holders have entered, and a significant decline is unlikely in the short term.
Finally, from the perspective of specific price performance, some analysts believe ETH may subsequently test $2,700–$3,000. On September 17, crypto analyst Ali posted that despite Ethereum's recent increased volatility, its price is still trading within a range. ETH's near-term rebound target is $2,570. If ETH can break through and hold above this level with volume, it could signal further strengthening, potentially testing $2,700 or even $3,000.