This article comes from: Michael Nadeau, founder of The DeFi Report
Compiled by Odaily Planet Daily ( @OdailyChina ); Translated by Azuma ( @azuma_eth )
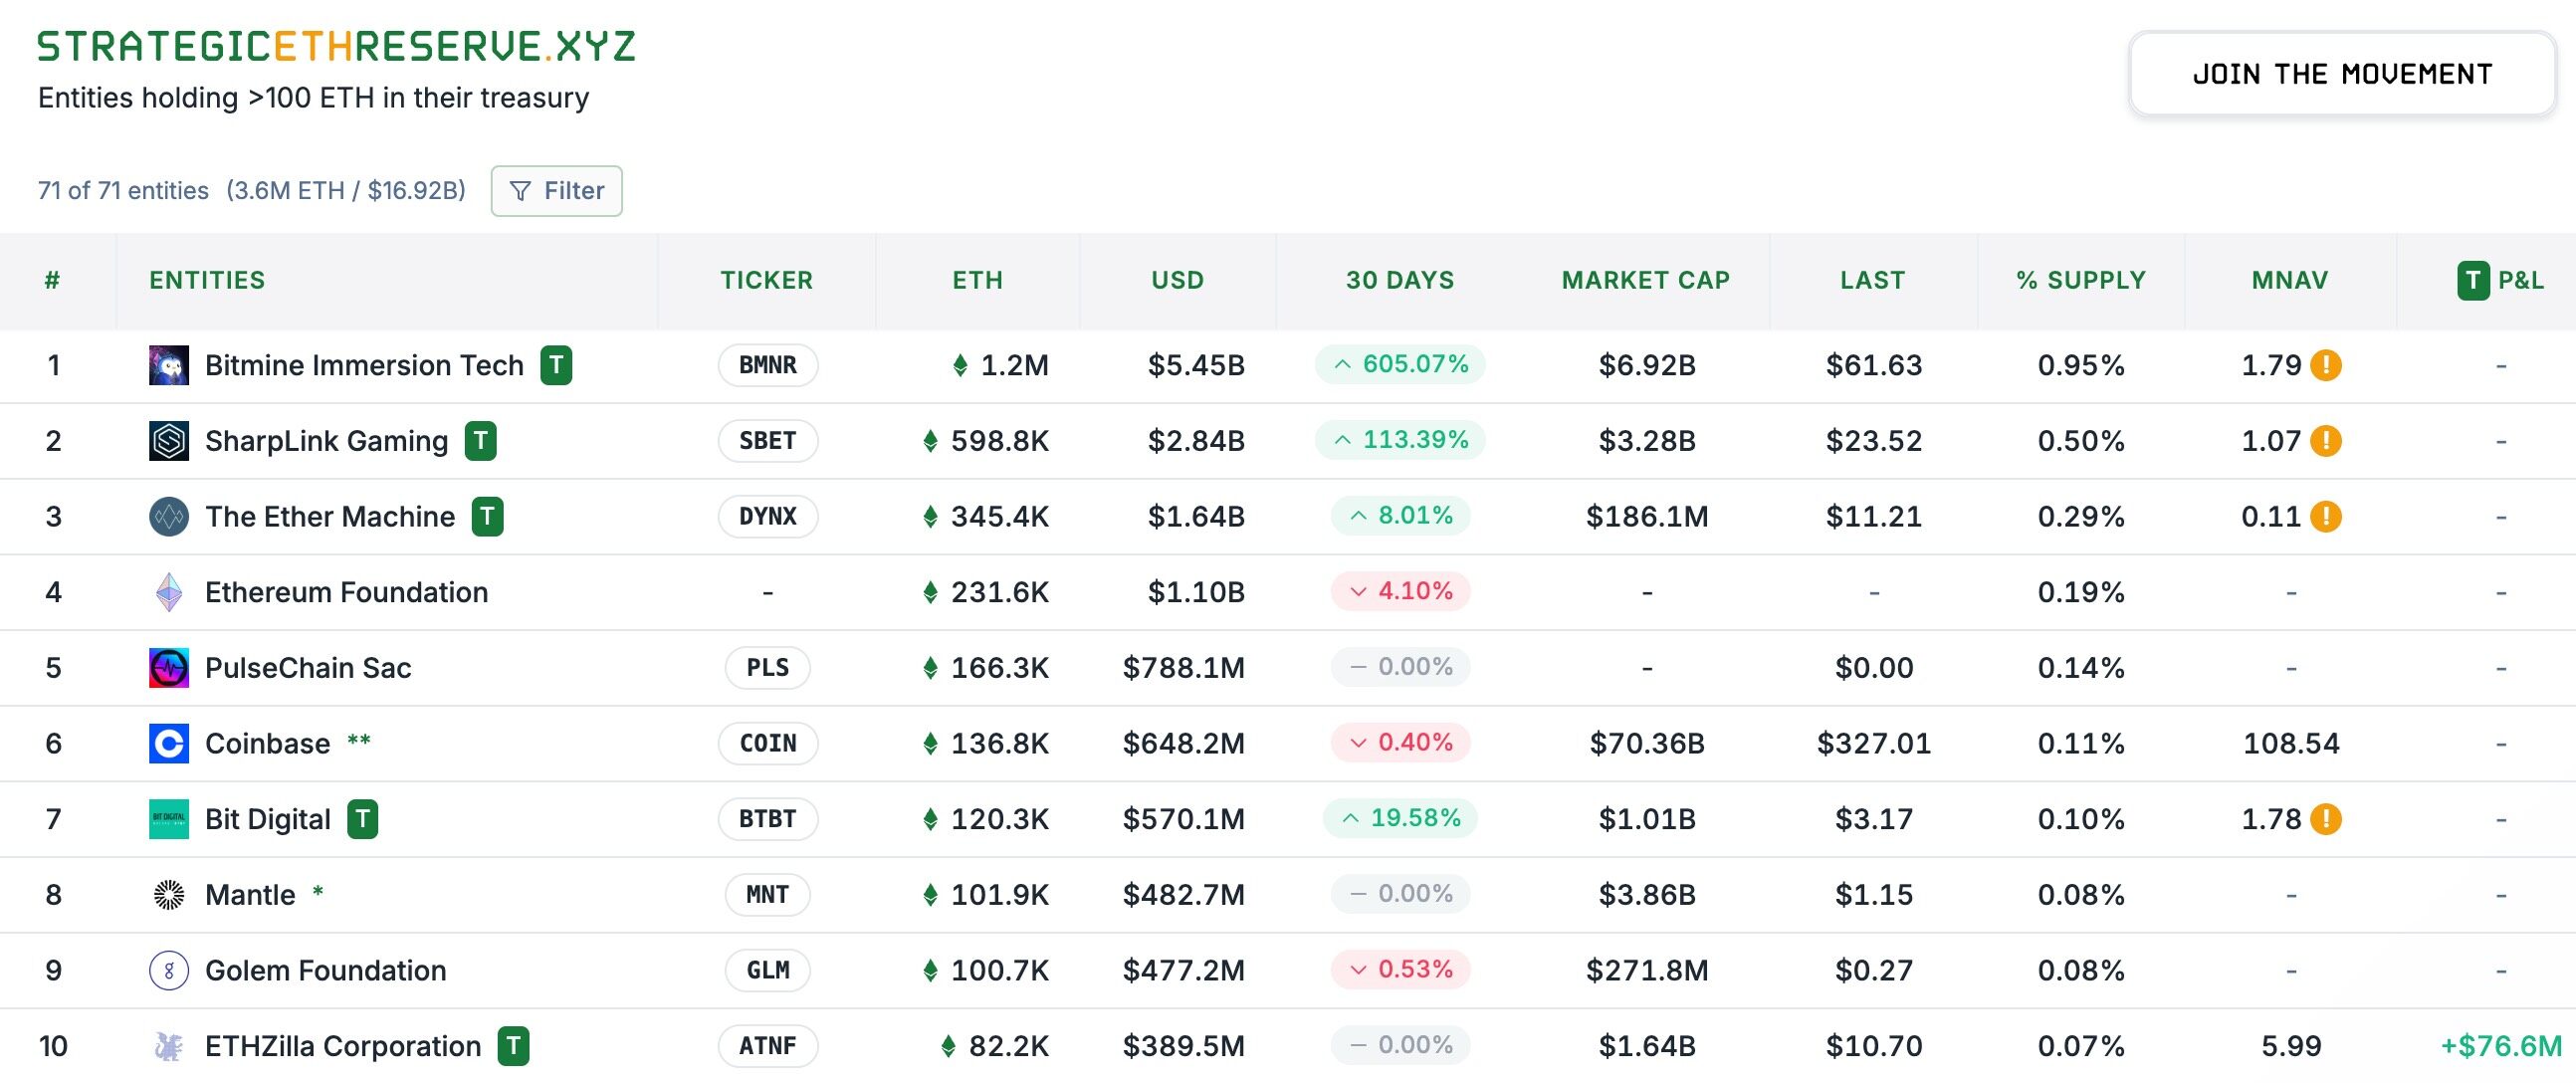
Editor's Note: The frenzied buying spree by ETF treasuries has become a hot topic in the market recently, exerting the strongest buying pressure on ETH prices. Data from Strategic ETH Reserve shows that as of August 14th (Beijing time), the combined holdings of major ETF treasuries reached 3.57 million ETH, valued at approximately $16.92 billion. BitMine (BMNR), Sharplink Gaming (SBET), and The Ether Machine (DYNX) ranked the top three with holdings of 1.2 million, 598,000, and 345,000 ETH, respectively.
This morning, Michael Nadeau, founder of The DeFi Report, who has been paying close attention to the status of ETH, reviewed the distribution and changing trends of ETF chips outside of Caiku Company (Note: Caiku Company's holdings will partially overlap with the classification below), which may help you determine the subsequent source of ETH's momentum.
The following is the original text by Michael Nadeau, translated by Odaily Planet Daily.
People often discuss ETH's price movements, but the real key lies in its distribution. Once you understand the actual distribution of ETH—among ETFs, staking contracts, Layer 2, wrapped tokens, exchanges, and more—you can gain insight into:
- Who has real control?
- Fund flow direction and actual liquidity scale;
- Where the next round of "buying shock" may come from;
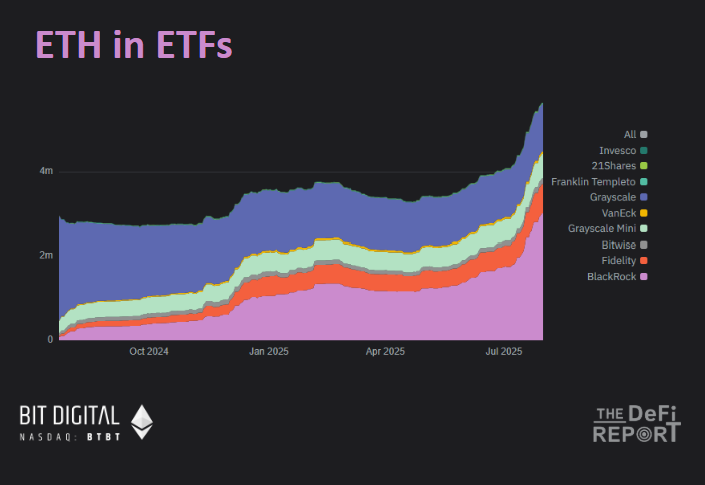
ETF holdings
Various Ethereum ETFs currently control approximately 5% of the ETH supply.
In the past three months, the assets under management of ETH ETFs have increased by 80%, of which BlackRock and Fidelity ETFs account for 73% of the assets under management.
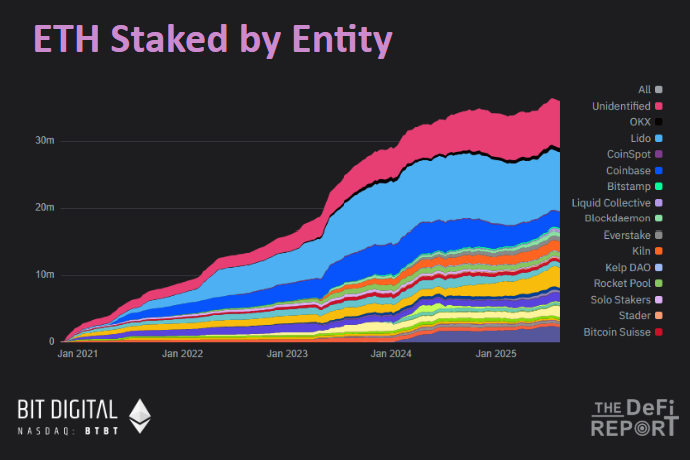
Pledge
Currently, approximately 29.7% of ETH is staked.
In the past three months, the scale of ETH staking has increased by 5%. During the same period, the market share of Lido, the leader in the staking track, decreased by 3.5%, while Binance's staking share increased by 23%, and currently ranks second in market share.
As more and more ETH treasury companies stake ETH, we expect this number to continue to rise in the coming months.
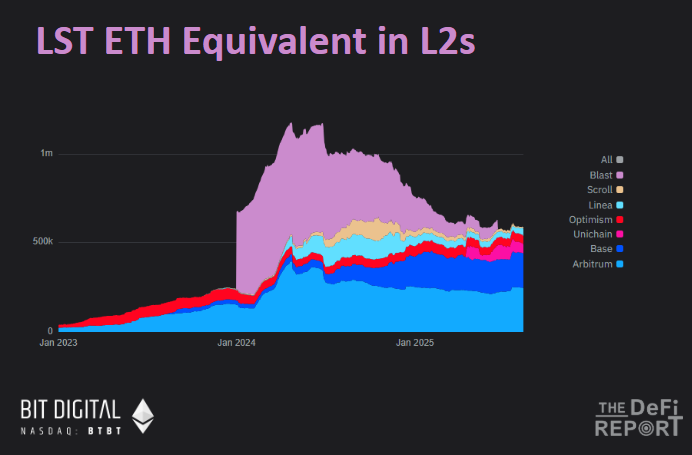
Layer 2 (included in LST)
ETH in Layer2 currently accounts for only 5% of the circulating supply.
A little over a year ago, Blast held 52% of the Layer 2 ETH supply, and now it's almost 0% — the incentive program is a complete waste of money. Currently, 41% of ETH on Layer 2 is in Arbitrum, and 33% is in Base.
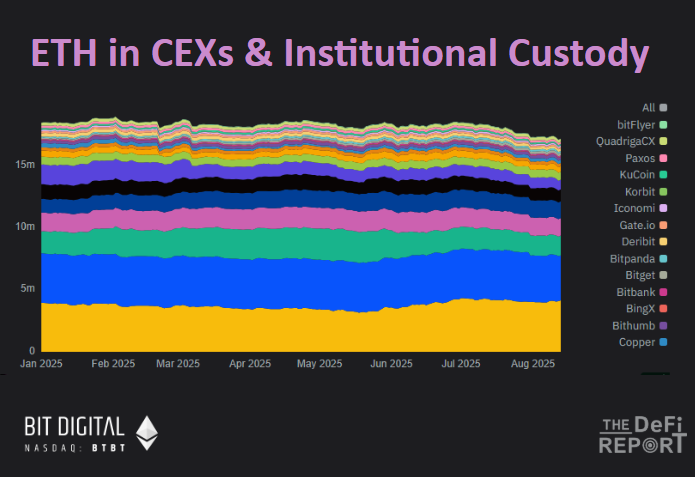
Centralized Exchanges (CEX)
Currently, the total amount of ETH in major CEXs accounts for 14% of the circulating supply.
The figure has fallen 6.7% since the third quarter and is now at its lowest level since July 2016.
Where did all this ETH go? Most of it went into staking contracts and cold wallets.
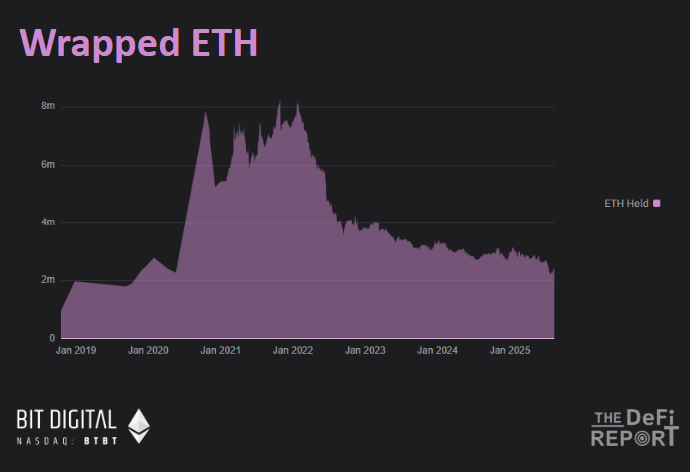
Wrapped ETH
Wrapped ETH currently accounts for only 1.8% of the circulating supply.
Since the beginning of 2022, this figure has fallen 70% from its peak, a downward trend that coincides with the upward trend of ETH in staking contracts.
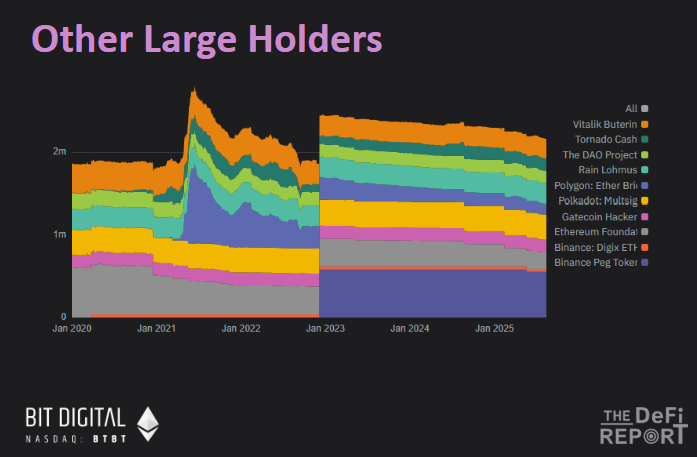
Other large holding entities and individuals
In addition to the above categories, the ETH holdings of other large holding entities and individuals account for a total of approximately 1.7%.
Of this 1.7%, Binance's Binance Peg Tokens Fund accounts for about 25%, while Polygon Bridge, Tornado Cash, the Ethereum Foundation and Vitalik himself are the main holders.
In total, the six charts above cover approximately 55% of the ETH supply. Beyond that, the majority of the remaining ETH is held in externally held accounts (EOAs) and cold storage.
- 核心观点:ETH分布格局决定价格走势。
- 关键要素:
- ETF持仓占5%,贝莱德富达占73%。
- 29.7%ETH质押,币安份额涨23%。
- CEX持仓降至14%,为2016年来最低。
- 市场影响:质押和ETF或推动ETH上涨。
- 时效性标注:中期影响。