



Bank of America's Hartnett: Rate Hikes Are the Biggest Bullish Catalyst, the Logic of "Bonds Ending the Bubble" Is Spreading


- Core View: BofA strategist Hartnett presents the "bonds ending the bubble" thesis, arguing that elevated interest rates are forcing a repricing of fiscal policy, elections, AI capital expenditures, and capital flows. The most bullish event for risk assets before year-end would paradoxically be a Fed rate hike in October, using proactive tightening to suppress runaway long-end yields.
- Key Elements:
- The U.S. 10-year Treasury yield briefly touched 5.36%, while the 30-year rose to its highest level since 2002; the France-Germany bond spread widened to 140 basis points, returning to stress levels seen during the European debt crisis.
- Asset performance has diverged this year: oil is up 58.5%, U.S. stocks up 13.4%, but government bonds down 4.4%, gold down 4.8%, and Bitcoin down 6.7%, with cash returns outperforming government bonds.
- Global central banks have hiked rates 54 times since 2026, marking the first net shift toward tightening since September 2023; the September FOMC minutes showed all 19 officials supported rate hikes.
- South Korea serves as a stress case study: bond yields rose approximately 200 basis points over 18 months, and the largest retail brokerage Mirae Asset has fallen 65% since May, yet Korean equities are still up 98.9% year-to-date.
- Fund flows show $166.4 billion in cash inflows, the largest since April 2020; money market funds hold approximately $8 trillion, generating roughly $330 billion in annual interest at a 4.2% yield.
- Midterm election risk skews negative: Polymarket gives Democrats a 64% probability of sweeping both chambers, which could correspond to a stock decline of over 10%; a divided government would correspond to a risk-on path with gains exceeding 5%.
- Key price levels to watch: 6% on the 10-year Treasury, 150 basis points on the France-Germany spread, the Bull & Bear Indicator dropping below 8, and global breadth at 88% net oversold — these are the thresholds for monitoring subsequent positioning.
Original Author: Zhao Ying
Original Source: Wallstreetcn
Over the past week, global markets were once again driven by interest rates. The U.S. 10-year Treasury yield briefly touched 5.36%, while the 30-year yield rose to its highest level since 2002. The 10-year Treasury auction priced at the highest yield since 2000, but near-record overseas demand pulled sentiment back. Across the Atlantic, the France-Germany bond spread widened to 140 basis points, returning to the stress range seen during the 2011-2012 European debt crisis.
Bank of America strategist Michael Hartnett compressed his core judgment into three words in the latest Flow Show: "Bond bubble bust." The most counterintuitive corollary followed: The most bullish event for risk assets before year-end would be a Fed rate hike in October — using a proactive tightening to stop long-end yields from spiraling further out of control.
This logic is not contradictory. U.S. stocks are still up 13.4% year-to-date, with the S&P 500, Nasdaq, and global tech indices still at highs, but government bonds are down 4.4% year-to-date, trailing cash returns by 7.2 percentage points. Stocks have not yet been knocked down by rates because U.S. hard data, global earnings expectations, and hyperscaler capex expectations have not been significantly revised down; bonds are the first to crack in more fragile places: Korean brokerages, French government bonds, and CCC-rated credit.
The real risk is not just "high rates," but that after rates rise, fiscal policy, elections, AI capex, and capital flows are all forced to reprice. If the Fed does not proactively hike, long-end yields may continue to climb; if Democrats sweep both chambers in the midterms, the political discount rate for stocks will suddenly change; if cash yields remain above 4%, the $8 trillion in money market funds may not be in a hurry to enter the stock market.
Bonds Hit First Where Dependence on Cheap Money Is Greatest
Hartnett used South Korea as a case study. Over the past 18 months, Korean bond yields have risen about 200 basis points; Mirae Asset, South Korea's largest retail brokerage, after previously becoming a "four-bagger," has fallen 65% since May.
This does not mean the Korean stock market bubble has already burst. Korean stocks are still up 98.9% year-to-date, one of the best-performing markets globally. It illustrates something else: when the cost of capital suddenly rises, the first casualties are often the segments with the highest financial leverage and trading heat.
Global central banks are also reinforcing this shift. Since 2026, global central banks have hiked rates 54 times; this is the first time since September 2023 that global central banks have turned back toward tightening on a net basis.

The divergence in asset performance further confirms this fracture. In the year-to-date performance ranking, oil is up 58.5%, U.S. stocks are up 13.4%, and global stocks are up 10.6%; cash returns are 2.8%, government bonds are down 4.4%, gold is down 4.8%, and Bitcoin is down 6.7%. The "humiliation" of bonds is most striking: holding cash has outperformed holding government bonds.
The October Hike Is Seen as Bullish Because Not Hiking Could Let the Long End Spiraling Out of Control
The main drivers of rising U.S. rates are broken into two parts: growth remains strong, and uncertainty is rising. Supply, commodity, and fiscal concerns also play a role, but they are not the core explanation.
The key change occurred after Jackson Hole. Previously, the market had an anchor: policy was already restrictive, and rates could eventually return to around 3%. BofA rate strategists pointed out that once this "anchor line" was cut, yields would continue to rise until data deteriorates or the market itself runs into trouble. Their conclusion is not friendly to those waiting for a top: "We believe neither condition is currently met. Any dovish suppression by the Fed on short-end pricing will only shift rate pressure to the longer end."
This time, the rise in 10-year Treasury yields since late September has mainly come from term premium, not from repricing the fed funds rate path. This makes the problem more thorny.
Hence the seemingly strange judgment: the Fed must either hike or face continued spike-ification of bond yields. The September FOMC minutes showed that all 19 officials supported a hike, with most believing another increase this year would be appropriate. But the market currently assigns only a 17% probability of a hike at the October 28 meeting, and an 81% probability for December 9. BofA rate strategists believe market pricing is wrong and have established corresponding trading positions (paying October FOMC OIS). Their statement is concise and direct: "If U.S. data remains strong, the Fed must choose: hike, or accept bond yield steepening. If frightened by bond steepening, the Fed will hike."
The bullish logic here is not that "a hike itself is good for stocks," but rather: If the Fed uses an October hike to prove it is willing to control inflation and term premium, the market may actually stop worrying about the 10-year yield charging toward 6%, and stock pressure would ease accordingly.
Fiscal Cracks Have Already Appeared, and France Is the Clearest Example
The other half of the rising rate problem is who pays the higher interest. BofA Chief Global Economist Claudio Irigoyen pointed out that the rate shock is "exposing the unsustainable reality of fiscal policy in developed economies," with the U.S. and France at the forefront, followed by Japan and the U.K.
The root of the problem lies in what economists call time inconsistency. Over the past 20 years, U.S. debt/GDP has risen by about 60 percentage points, and France by about 50 percentage points, mostly during the zero-rate era. This debt supported permanent spending and permanent tax cuts. Now financing costs have normalized, but there is a lack of political votes to cut spending or raise taxes. Both countries have debt/GDP of about 120%, and primary deficits exceeding 2.5% of GDP; the U.S. overall deficit is about 6% of GDP, and France about 5%, with the U.S. higher mainly due to a heavier interest burden.
France is the clearest rupture. According to Bloomberg, the France-Germany bond spread has returned to 140 basis points, the fastest selloff in French sovereign spreads in at least 20 years, even faster than in 2011. The market is not giving France fiscal patience, and several data points stand out: since the post-pandemic peak, developed economy debt/GDP has fallen by an average of 11 percentage points, but France has not declined; French private non-financial debt reaches 214% of GDP, versus 140% in the U.S.; the median net income of French retirees is nearly close to that of active workers; France has not achieved a primary budget surplus since 1974.
According to The Wall Street Journal, Paris is considering increasing short-term Treasury issuance. Rabobank commented that this is "the latest example of a developed market economy behaving like an emerging market." BofA European credit strategist Barnaby Martin expects the France-Germany spread to oscillate in the 100-150 basis point range; if it rapidly approaches the upper end of that range, the probability of short-term debt issuance, ECB verbal intervention, or even discussion of the TPI tool will rise.
Stocks Not Yet Falling Does Not Mean Rate Hikes Aren't Biting
High rates have not been without impact; they just have not yet bitten the market's most core assets.
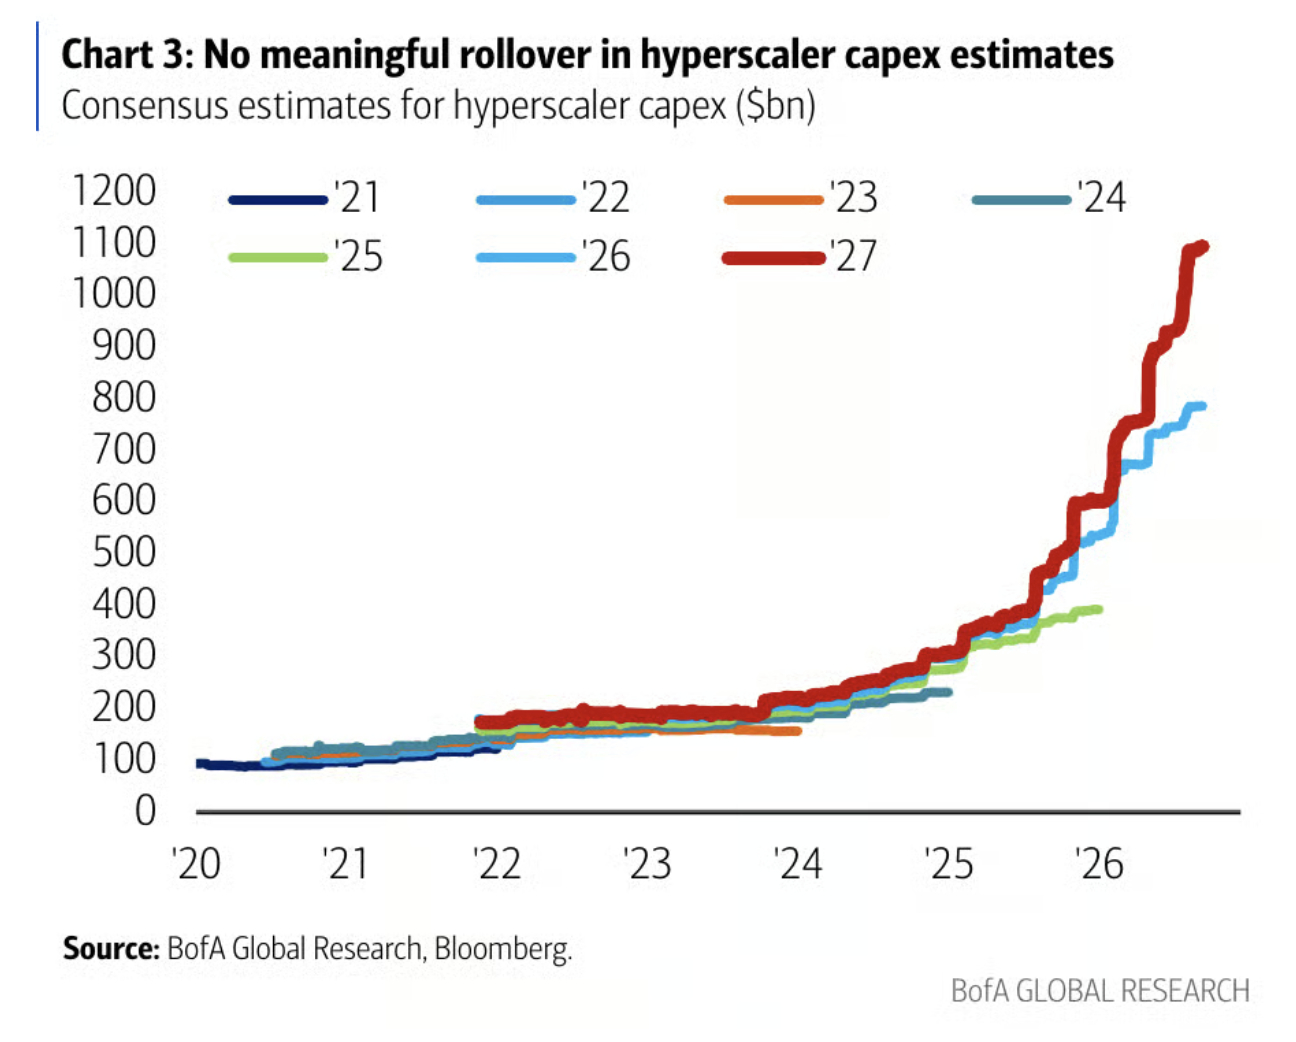
U.S. hard data has not clearly rolled over, and global forward earnings expectations have not rolled over either. More importantly, hyperscaler capex expectations are still rising, and 2027 consensus is still climbing steeply. As long as AI capex continues to support real demand, there is reason for yields to keep rising. BofA strategist Barnaby Martin's judgment is: the moment U.S. macro data rolls over is when rate volatility peaks and the credit market gets a green light again.
The credit market is already reflecting stress at the margins. In the September high-yield spread widening, less than 30% can be explained by higher refinancing costs or expected losses, with the rest more like a rate volatility premium. CCC spreads have risen to 1200 basis points, the highest since 2022.
There are also signs of loosening within equities. The BofA Bull & Bear Indicator fell from 8.8 to 8.1, down from 9.3 two weeks ago, still in "sell" territory. The global breadth rule shows that a net 50% of global stock indices are oversold, meaning simultaneously below their 50-day and 200-day moving averages; but the contrarian buy signal only triggers at a net 88%, and unless tech-heavy markets like the U.S. and South Korea reverse quickly, it will be difficult to reach that threshold in the short term.
$8 Trillion in Cash Is Not a Natural Buyer
The fund flow data gives a fairly clear signal.
As of Wednesday of that week, cash inflows were $166.4 billion, the largest since April 2020; bond inflows were $33.8 billion, stock inflows were $12.4 billion, gold inflows were $2 billion, and crypto asset outflows were $600 million. The $118 billion in cash that flowed out the previous week due to quarter-end factors not only all came back, but flowed in excess.
Breaking it down, Treasury inflows were $16.2 billion, the largest since April 2025; investment-grade bond inflows were $10.3 billion; bank loan inflows were $2.4 billion, the largest since February 2025, with floating-rate products becoming a rate-hike hedge. Tech stocks still saw $3.5 billion in inflows, while financial stocks saw $3 billion in outflows, the largest since March 2023.
Money market fund assets have reached about $8 trillion, up from $5 trillion in 2023. At a 4.2% T-bill yield, this money generates about $330 billion in annual interest income.
Hartnett's liquidity note is more direct: "No rate cuts, no decline in cash." Historically, large-scale sidelined cash entering the stock market usually occurs after large-scale monetary easing, such as 2009 QE, 2020 QE4, or during a sustained Fed rate-cutting cycle. The current environment does not meet that condition.
The Midterms Give the Market an Uncomfortable Probability Distribution
The U.S. midterm elections on November 3 are the event most likely to trigger a 10% move in stocks over the next few months.
Polymarket currently gives Democrats a 64% probability of sweeping both chambers, up from 49% in September; the probability of Republicans holding the Senate and Democrats taking the House is 28%; the probability of a Republican sweep is only 9%. Trump's approval rating is 38%, his approval on economic issues is 34%, and on inflation it is 27%.

What makes the market most uncomfortable is that the currently most probable outcome corresponds precisely to the most risk-averse path.
In a scenario where Democrats sweep both chambers, stocks could fall more than 10%, the dollar and bond yields would retreat, international stocks would outperform U.S. stocks, and Europe could outperform Asia. Tax and regulatory directions would rise, which is bad for EPS. More importantly, the political capital of the Trump administration to push resource monopolies and corporate policy cooperation would decline.
If Republicans hold the Senate and Democrats take the House, that corresponds to the "divided government = Goldilocks" risk-on path, with stocks potentially rising more than 5%. If Republicans sweep, that is the biggest upside surprise, with stocks potentially rising more than 10%, and the AI trade continuing to bubble toward 2027.
The most critical state to watch may be Texas. Republican incumbent Governor Greg Abbott leads Democratic challenger Hinojosa by only 48% to 46% in polls. Texas is also a focal state for AI data center approvals and power grid strain, and the conflict between "affordability" and AI capex will be repriced at the ballot box.
Outside the U.S., the Political Rightward Shift Trade Continues
U.S. political risk skews negative, but overseas there is another logic line: the rightward shift trade.
Brazil's Bolsonaro won the first round, with the second round on October 25. Of the 20 Latin American countries, 11, with about 420 million people, are now under right-wing leadership; before the previous election cycle, that number was 7 countries and about 60 million people. The market reaction was direct: Brazilian stocks hit a record high, and the 10-year yield plunged 124 basis points in a single day.
The MSCI Latin America index is still 35% below its all-time high, which is also the reason Latin America has been included in the global rotation bull market sequence: the first half of 2025 was Europe, the second half of 2025 to the first half of 2026 was Japan and emerging Asia, and now it is Latin America and broader emerging markets' turn.
Europe also has similar political variables. Italy and Germany have shown signs of a rightward shift, and Le Pen leads in polls for France's April 2027 presidential election. Spanish Prime Minister Sánchez announced early elections, with voting day set for November 29, and polls show the center-right leading — Hartnett characterized it as "an underappreciated positive event for European bonds."
Next, Watch Price Levels; Several Key Levels Matter More Than Macro Narratives
Under this framework, short-term positioning leans toward risk reduction before the midterms. Three clues support this judgment: global central banks are tightening net again, financial conditions are tightening, and early signals of credit events are still appearing, including the AUD/JPY exchange rate, risk parity strategies, and credit default swaps of tech companies such as Oracle and SoftBank.
Tech stocks are not suitable for continued chasing at highs because investors are already heavily positioned; MAGS may still outperform SOX, and Chinese tech stocks have contrarian appeal. On the bond side, position early for peak yield trades: 30-year Treasuries, small caps, REITs, and Hong Kong real estate. The broad direction remains holding gold, commodities, and emerging markets.
Several price levels are more actionable than macro slogans: 6% on the 10-year Treasury is the key area where bond buyers are waiting; a 150 basis point France-Germany spread is close to the level where the probability of policy backstops rises; a net 88% oversold reading on the global breadth rule is the stronger contrarian buy signal; a Bull & Bear Indicator below 8 is closer to the risk-easing zone than the current 8.1; and the 30-year Treasury auction yield has already reached 5.618%, which is also a practical handle for positioning early in long bonds.
The calendar is also dense: Brazil's second round on October 25, FOMC on October 28, U.S. midterms on November 3, Shenzhen APEC on November 18, Spanish elections on November 29, FOMC on December 9, and Miami G20 on December 14.
Hartnett concluded with one sentence: "Most investors are waiting for the 10-year yield to reach 6% before buying Treasuries; we are positioning early with a small allocation to the 'peak yield' trade." If the Fed hikes in October and suppresses the long end, risk assets may actually