



Half of all stocks have entered a bear market, US equities at a "crossroads," with the key being US Treasury volatility


- Core View: There is an approximately 12% divergence gap between US equity indices and market breadth, and the direction in which it ultimately converges depends on whether US Treasury volatility can cool down—if the MOVE Index remains elevated, the S&P 500 could pull back to 6,800-7,300 points; if bond volatility subsides, catch-up gains in individual stocks will drive both the index and breadth higher together.
- Key Elements:
- 51% of Russell 3000 constituents have fallen more than 20% from their June highs and entered bear market territory, the median S&P 500 stock is 16% below its 52-week high, and market breadth has dropped to its lowest level since the dot-com bubble.
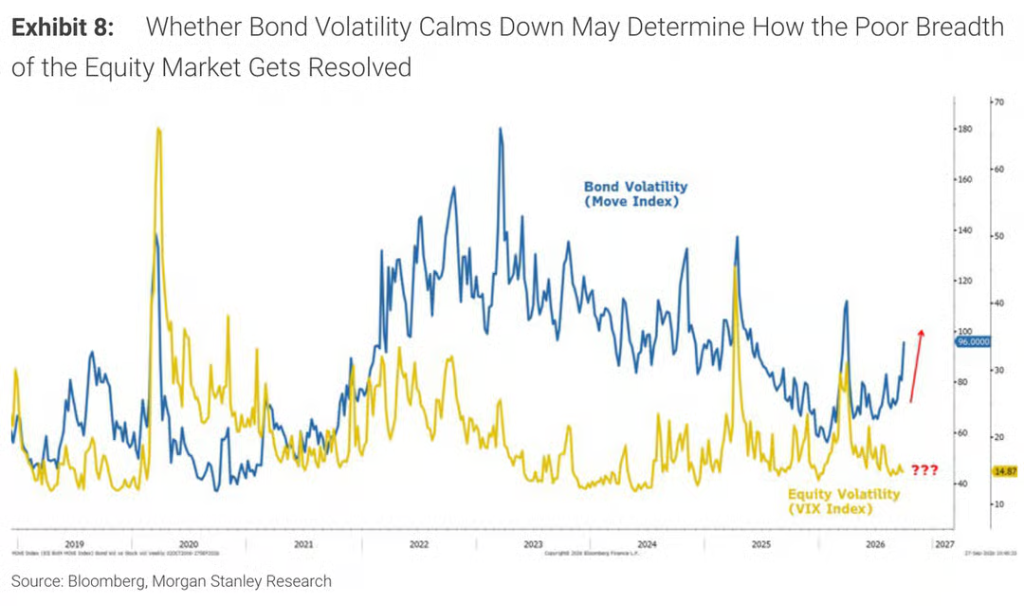
- The 10-year US Treasury yield has returned to 5.25%, the MOVE Index has broken above 100, while the VIX remains below 15—a rare divergence in stock and bond volatility.
- The deterioration in breadth was triggered by the Fed's hawkish pivot following the August Jackson Hole central bank symposium, rather than rising oil prices; the number of days this year in which price and breadth diverged reached 57, matching a 30-year record.
- Fundamentals have not deteriorated: S&P 500 Q2 EPS grew 51% year-over-year, and the forward P/E declined from 23x to 19x—this is valuation compression rather than an earnings slowdown.
- Morgan Stanley recommends sticking with large-cap quality stocks; if the index pulls back, it would be a window to add to risk assets, likely within the next month.
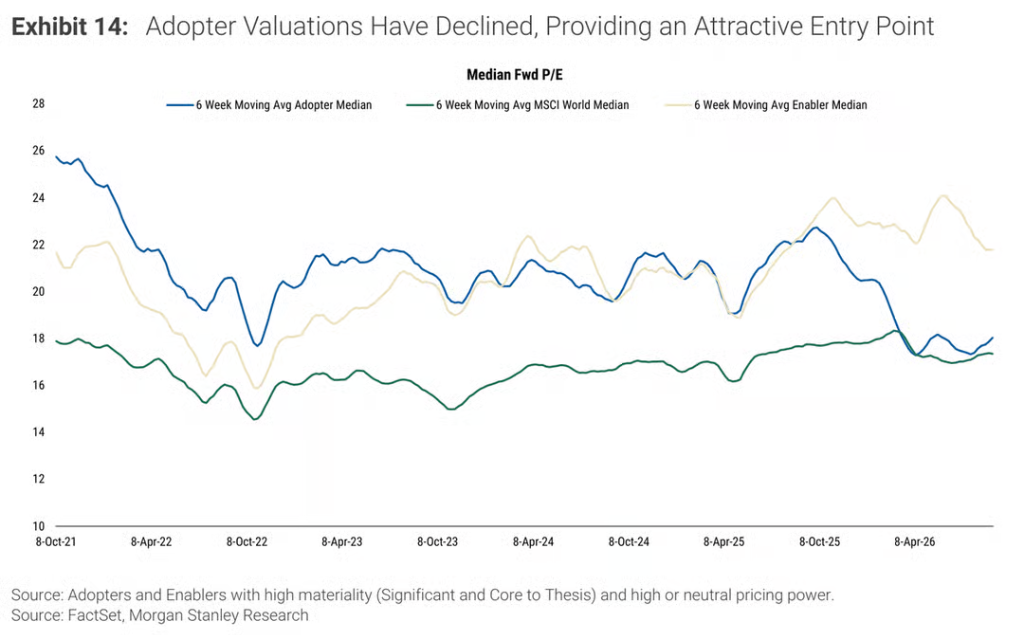
- The AI theme is rotating from "enablers" to "adopters," with the median adopter trading at just 18x forward P/E, well below the 22x for enablers.
Original Author: Dong Jing
Original Source: Wallstreetcn
U.S. equity indices are hovering near historic highs, but the market's internals have quietly split apart.
Morgan Stanley Chief Equity Strategist Mike Wilson issued a warning in his latest report: there is currently a roughly 12% divergence gap between U.S. equity market breadth and index price levels, and this divergence must be resolved one way or another—either the index pulls back downward to "meet" market breadth, or bond volatility cools and individual stock catch-up pushes the index higher. Two paths, pointing in opposite directions, and there is only one final arbiter: the U.S. Treasury market.
Currently, 51% of Russell 3000 constituents have fallen more than 20% from their June highs, officially entering bear market territory. The median S&P 500 stock is 16% below its 52-week high, and market breadth has fallen to its lowest level since the dot-com bubble burst. Meanwhile, the 10-year Treasury yield has returned to 5.25%, the MOVE index measuring Treasury volatility has broken above 100, while the "fear gauge," the equity volatility index VIX, remains below 15. This rare divergence between stock and bond volatility has put the market on high alert.
Wilson's conclusion is: if bond volatility cannot subside, the S&P 500 could dip to the roughly 6,800 to 7,300 range within the next month, before a year-end rally becomes possible; if bond volatility cools first, individual stock catch-up will drive both the index and breadth higher together.
Half of All Stocks Already in Deep Bear Market as Index "Illusion" Masks Internal Collapse
On the surface, the S&P 500 is still trading near historic highs, but the damage beneath the surface is already quite severe.
In the latest edition of his "Weekly Warm-up" report, Wilson noted that 51% of Russell 3000 constituents have fallen more than 20% cumulatively from their June highs, deteriorating further from "over 40%" two weeks ago. Meanwhile, the S&P 500 forward P/E has declined to about 19x, matching the low point during the most intense phase of the Iran conflict in March of this year.

By sector, the damage is highly uneven. In semiconductors, 96% of stocks have fallen more than 20% from their June highs, with 69% down more than 40%; in autos, 71% of stocks are down more than 20%, and every single auto stock has declined at least 10%; in software, the figure is 75%. Banks are the exception, with only 4% of stocks experiencing comparable drawdowns.
Wilson characterized these hardest-hit areas as "classic early-cycle winners"—semiconductor and auto stocks significantly outperformed from the April 2025 rolling recession trough to June 2026, but Morgan Stanley signaled as early as June that earnings revision breadth for these early-cycle winners had peaked, and the market was transitioning from early-cycle to mid-cycle, with quality factors set to take the lead. The Fed's hawkish pivot is yet another classic signal of this cycle transition.
Goldman Sachs data further corroborates this judgment. According to Goldman Sachs TMT strategist Peter Callahan, the median S&P 500 stock is currently 16% below its 52-week high, and market breadth has fallen to its lowest level since the dot-com bubble burst. Goldman Sachs warned as early as May 1 that sharp declines in breadth "have historically tended to precede above-average drawdowns for the S&P 500 over the subsequent 6 to 12 months," and five months later, this metric continues to deteriorate.
The Trigger for Breadth Collapse: Jackson Hole, Not Oil Prices
The deterioration in market breadth did not happen overnight, and Wilson's timeline analysis is particularly instructive.
Throughout the summer, the proportion of S&P 500 constituents trading above their 200-day moving average rose from 59% at the end of May to about 75%. Even against the backdrop of rising crude oil prices and Treasury yields simultaneously, market breadth continued to improve. However, this trend reversed sharply after the Jackson Hole Global Central Banking Symposium in late August, and the ratio has now fallen to 49%.
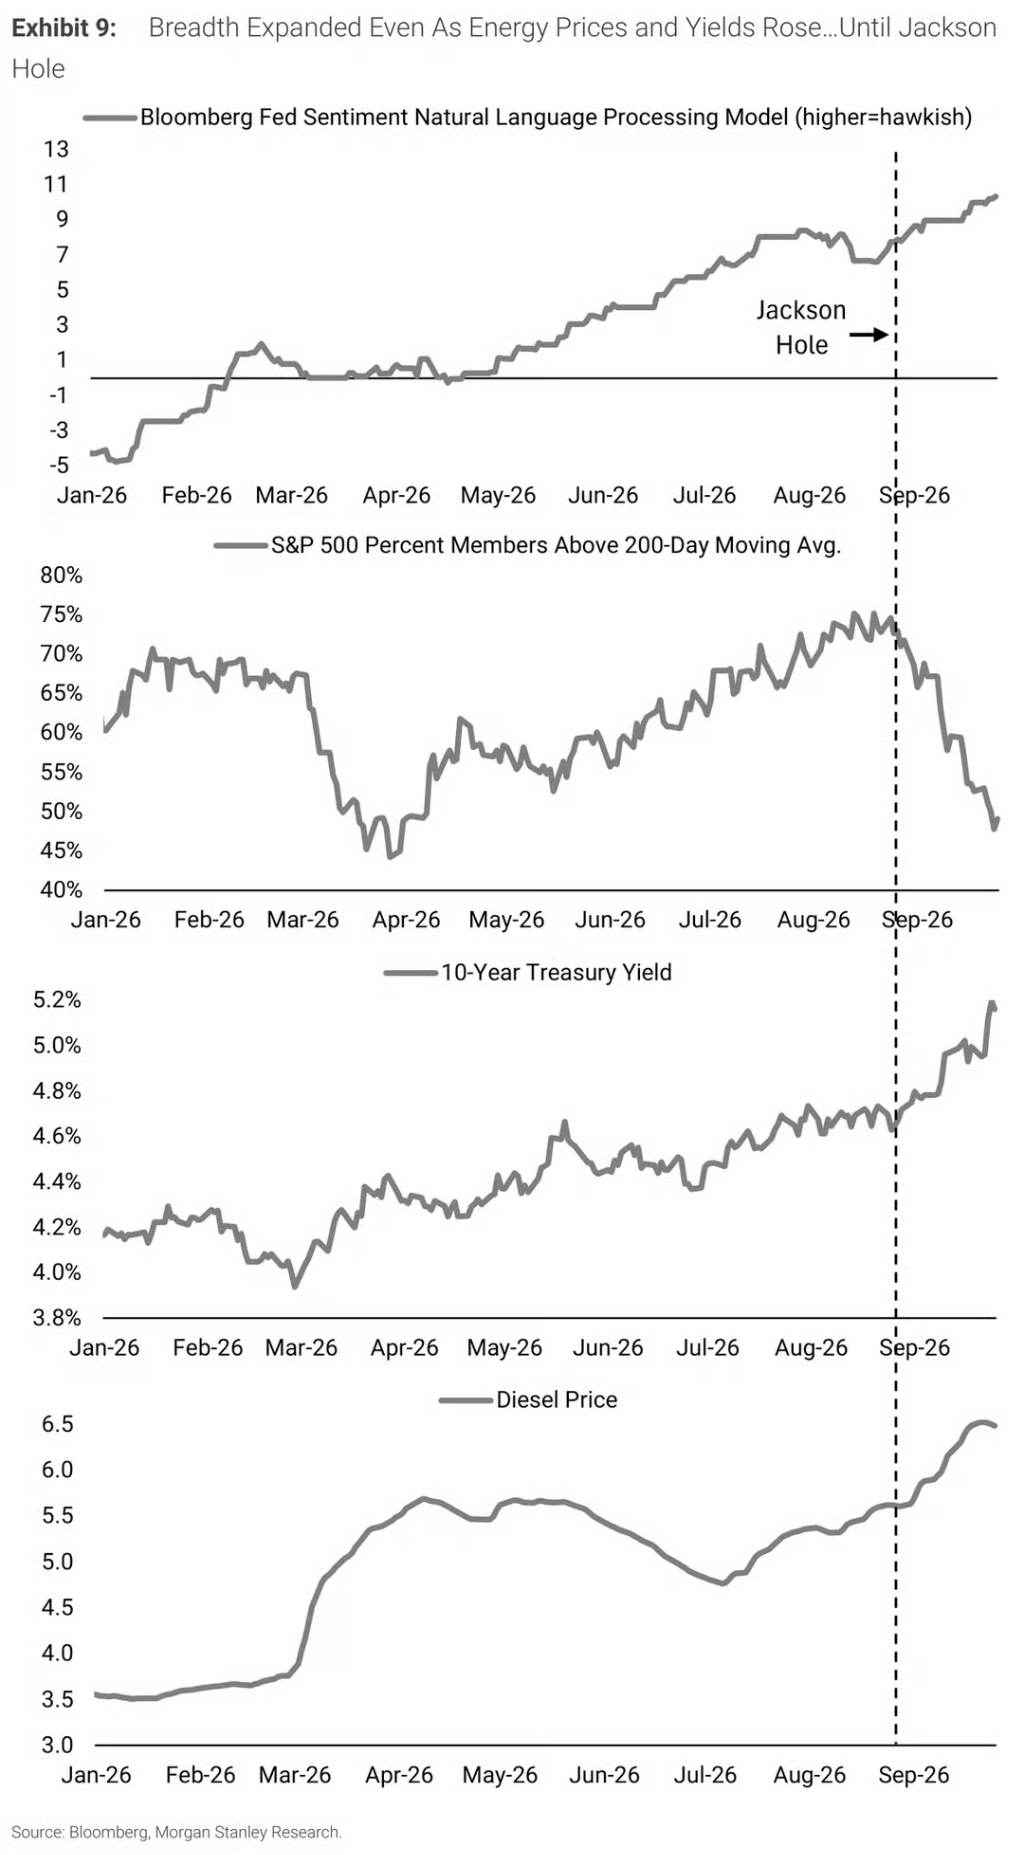
Wilson explicitly pointed out that the sudden narrowing of breadth was not triggered by rising oil prices, but rather by the market beginning to price in a more hawkish Fed path after Jackson Hole.
"The same shift is clearly visible in the rates market. Accelerating nominal GDP growth and rising energy prices drove yields higher in the first half, but since late August, further increases in yields increasingly reflect the Fed's hawkish pivot—a pivot occurring against a backdrop of strong economic growth, which is not bad for the broader stock market but has indeed affected market leadership."
BTIG strategist Jonathan Krinsky's statistics provide corroboration from another dimension: according to data cited by Bloomberg, there have been 57 trading days this year where price and breadth moved in opposite directions, matching the highest record of the past 30 years—and that was with four and a half months still left in the year.
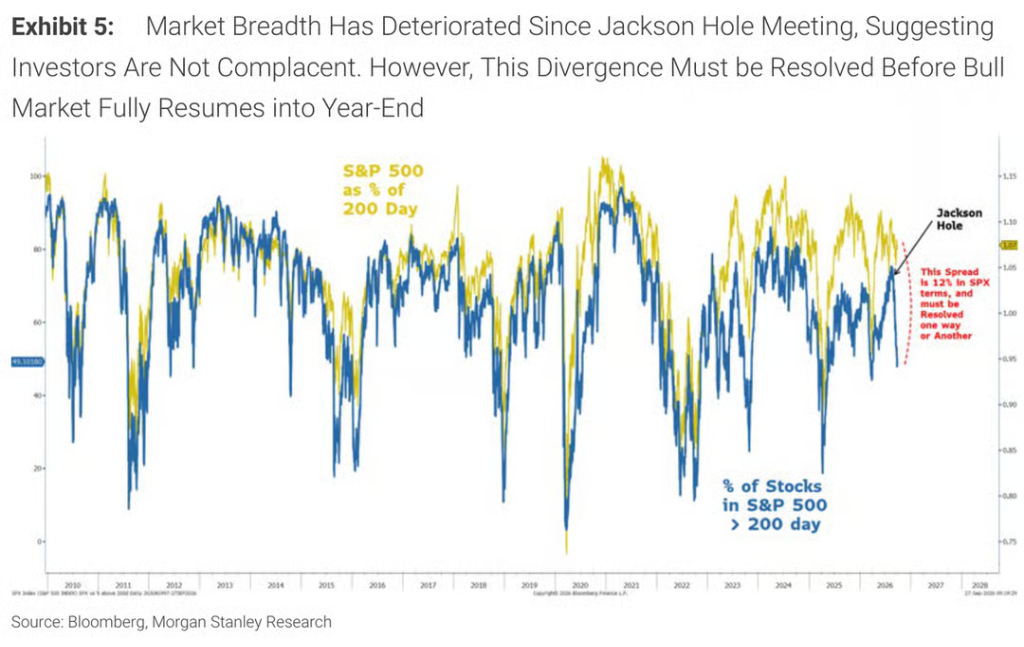
Wilson quantified the current divergence between the index and breadth as "a gap of approximately 12% as measured by the S&P 500, which must be resolved one way or another."
Fundamentals Have Not Stalled, but Valuation Compression Is Already Underway
However, despite deteriorating market breadth, Morgan Stanley and Goldman Sachs have rarely agreed on the fundamental assessment: the current market weakness is not due to deteriorating fundamentals, but rather the result of valuation compression.
Wilson noted that EPS revision breadth for the S&P 500 is 25%, far above the 7% for the lower-quality Russell 2000, with median stock EPS growth in the mid-teens range. "The index has gone nowhere since early June, not because earnings have stalled, but because valuations have absorbed the shock."
On the Goldman Sachs side, according to Goldman data cited by Bloomberg, S&P 500 Q2 EPS grew 51% year-over-year, the forward P/E has declined from about 23x to about 19x, and Goldman's 12-month target of 8,700 almost entirely excludes any contribution from valuation expansion.
Notably, Morgan Stanley's 2026 EPS forecast is $339, about 6% below the bottom-up consensus of $361—even this strategist, who insists that "earnings are carrying the load," has a forecast that is notably below market consensus.
Treasury Volatility: The Final Variable Determining Market Direction
Wilson boils the current situation down to two scenarios, with the dividing line entirely dependent on whether Treasury volatility can cool.
Scenario One: If bond volatility remains elevated, market breadth and index price will "meet in the middle" within the next month, implying roughly 6% downside pressure for the S&P 500, corresponding to an index level of about 7,300, followed by a potentially strong year-end rally.
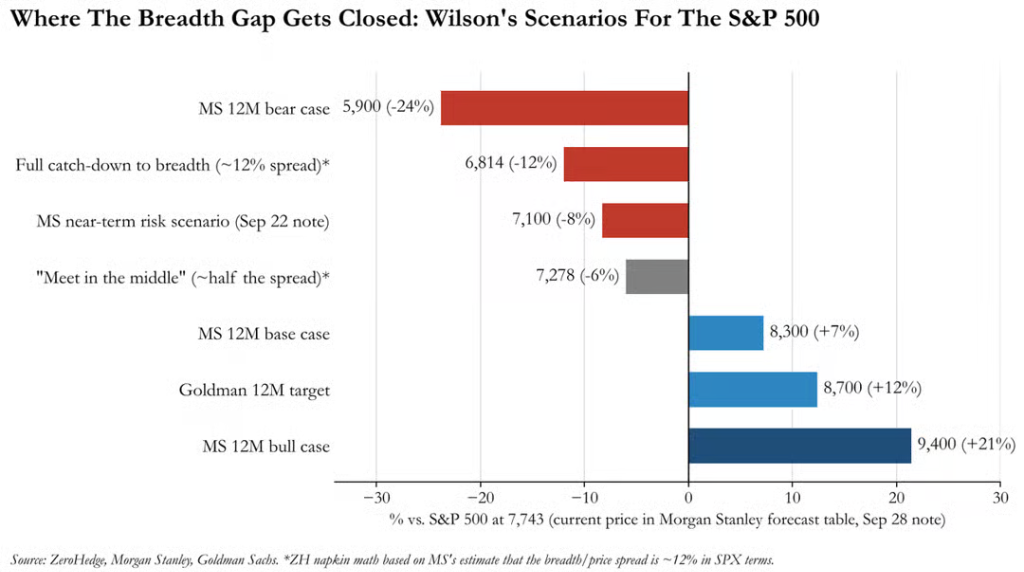
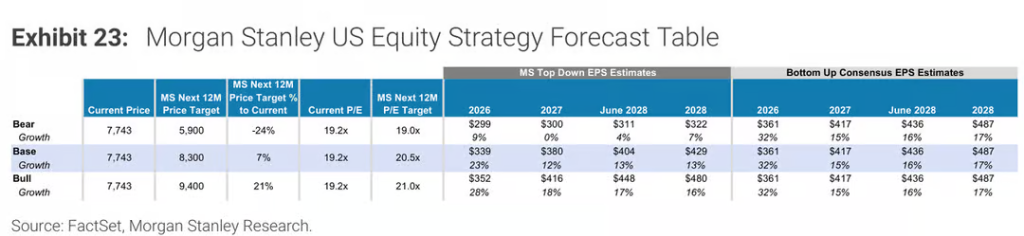
Scenario Two: If bond volatility subsides first, individual stock breadth will catch up to index price, driving both higher together.
Wilson has long viewed 4.50% as the critical threshold at which the 10-year Treasury yield exerts substantive pressure on equity valuations. After the 10-year Treasury yield broke above this level in May, the S&P 500 forward P/E has been declining steadily. As of last Friday, the 10-year Treasury yield has returned to 5.25%, erasing all gains following the nonfarm payrolls data release.
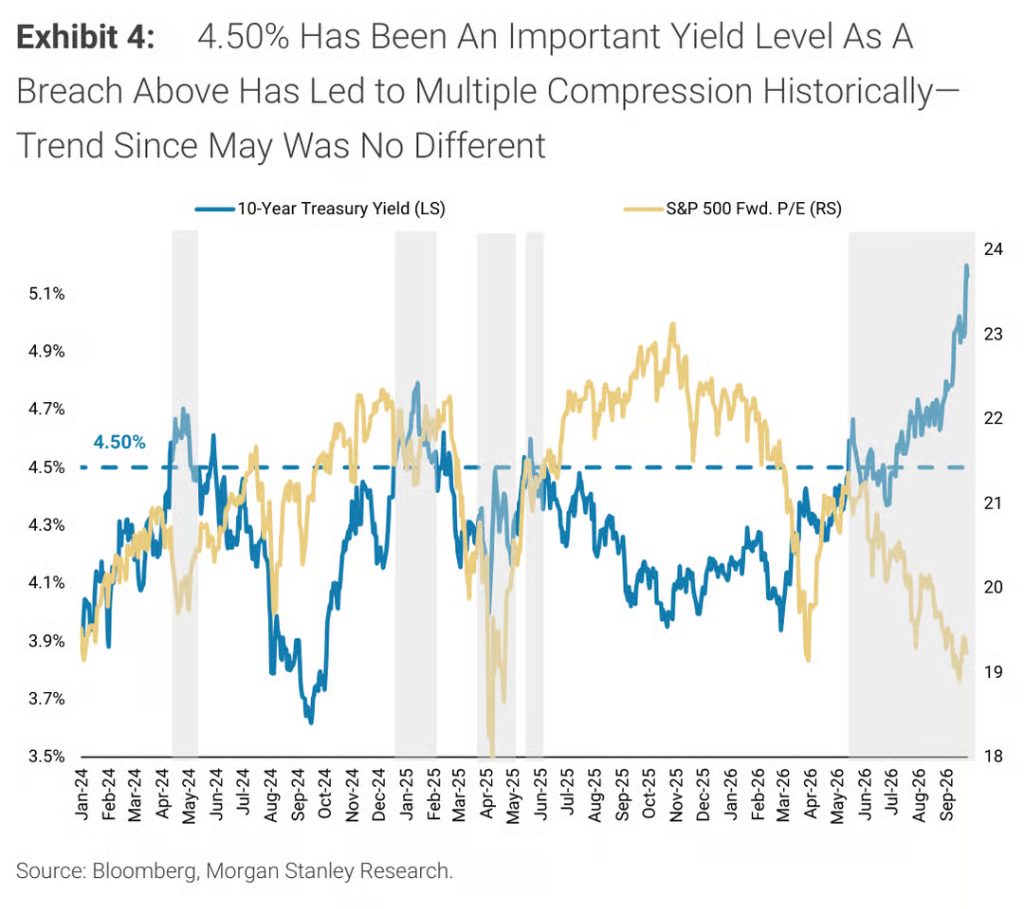
The MOVE index measuring Treasury volatility has now broken above 100, while VIX remains below 15. Wilson noted that "the calmness of VIX during the recent collapse in breadth and valuations is remarkable," and marked this anomalous divergence with a red question mark. He believes that whether and when stock and bond volatility can synchronize will ultimately determine how the gap between breadth and the index is resolved.
The "Warsh Put": It Exists, but No One Knows the Strike Price
Notably, Wilson devoted specific discussion in his report to the variable of new Fed Chair Warsh and its impact on market pricing.
Since Jackson Hole, the 2-year Treasury yield has risen nearly 60 basis points, with the market interpreting Warsh's signals as: inflation not only needs to fall, but needs to fall "fast enough." The September rate hike further reinforced this reaction function.
However, Wilson believes the bond market may be overreacting. "In our view, the bond market may have recently shifted to an excessively hawkish stance." He also noted that term premiums are still behaving well, which somewhat alleviates concerns about fiscal sustainability or the Fed falling seriously behind the curve.
More critically, Wilson offered a unique interpretation of Fed Chair Warsh's monetarist stance:
"The market may be assuming too many rate hikes over the coming year while underestimating Warsh's willingness to use the balance sheet to finance deficits or stabilize financial conditions at the first sign of trouble. Our judgment is that Warsh will ultimately provide liquidity when necessary, but the market may want to test his resolve first. The recent rise in yields and bond volatility is precisely a step in that direction."
In other words, the "Warsh put" objectively exists, but its strike price remains unclear—and the market appears to be actively searching for that price.
Wilson Advises Sticking with Large-Cap Quality Stocks, Waiting for Entry Timing
At the current stage, Wilson advises sticking with large-cap quality stocks, especially asset-light companies with continuously improving earnings revisions, and focusing on quality and operational efficiency factors such as high free cash flow yield, low accruals, and high revenue per employee.
If the index does pull back, completing "an adjustment that has been underway beneath the surface for months," Wilson believes that would be the time to add to higher-risk stocks, with a window of approximately the next month.
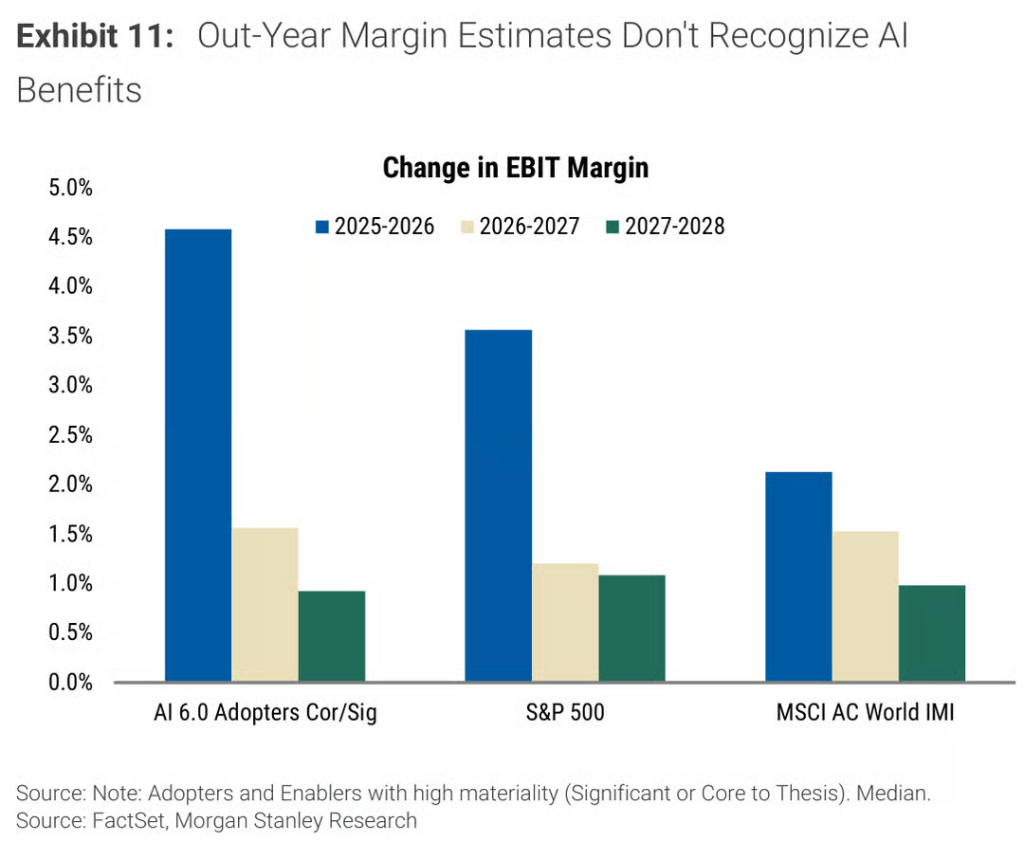
On the AI theme, Morgan Stanley analyst Michelle Weaver's sixth AI mapping analysis of approximately 3,600 global stocks shows that the market is rotating from "AI enablers" to "AI adopters." The consensus expects highly AI-correlated adopters to achieve 4.6% EBIT margin expansion in 2025-2026, exceeding the S&P 500 overall level, but this advantage almost completely disappears in longer-term forecasts, suggesting analysts have already priced in initial AI benefits into valuations but have not fully priced in their sustainability.
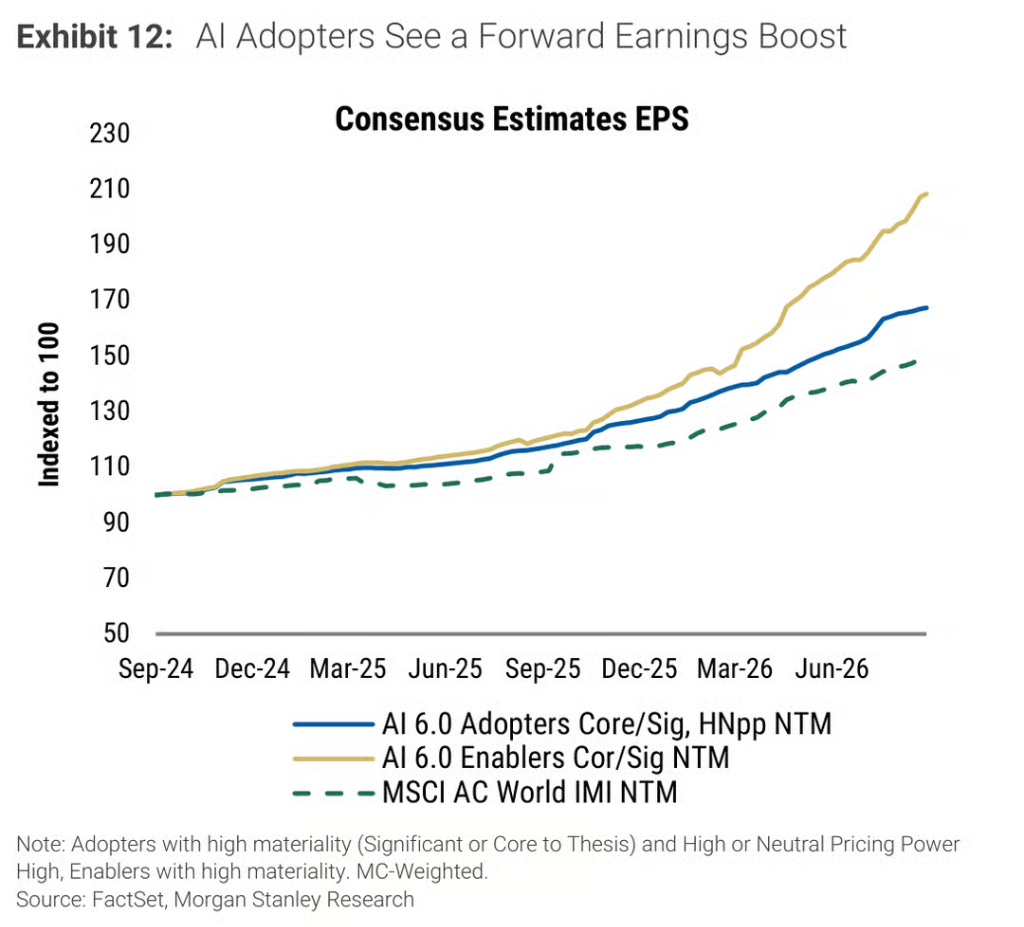
At the valuation level, forward 12-month EPS for highly AI-correlated adopters has risen about 70% cumulatively over two years (enablers more than doubled), but the median adopter currently trades at only 18x forward P/E, in line with the MSCI Global Index and well below the 22x for enablers.
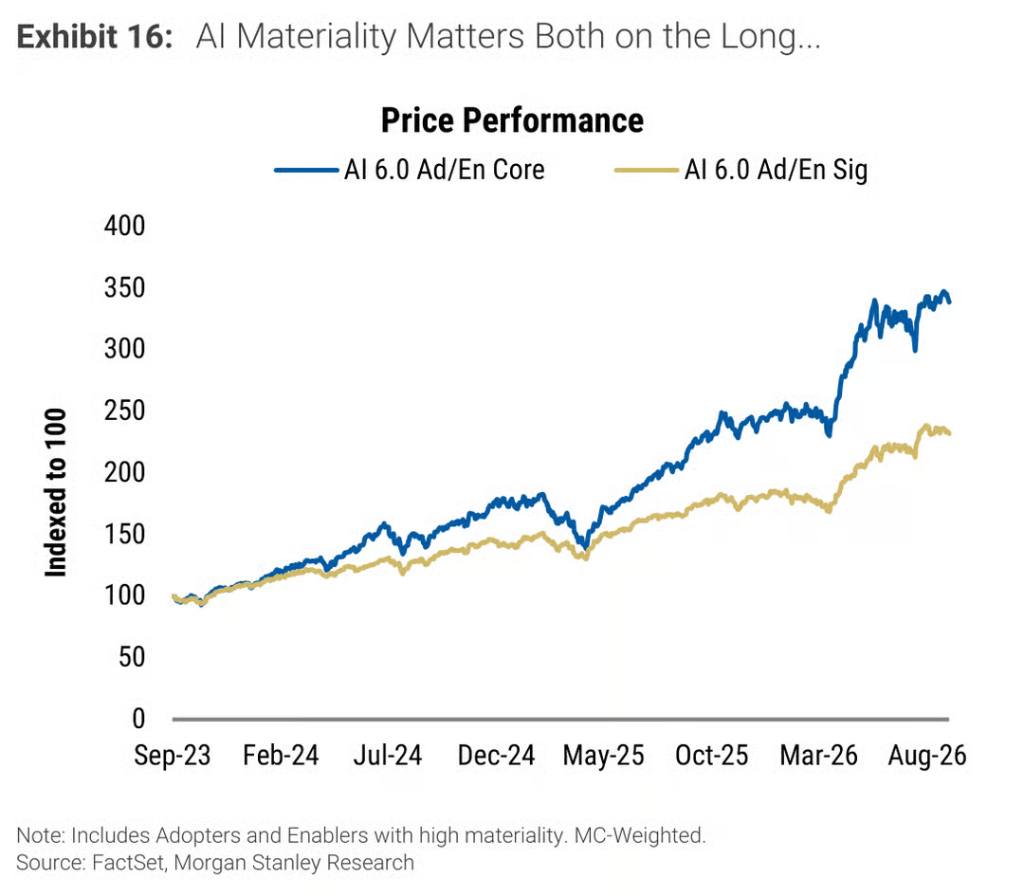
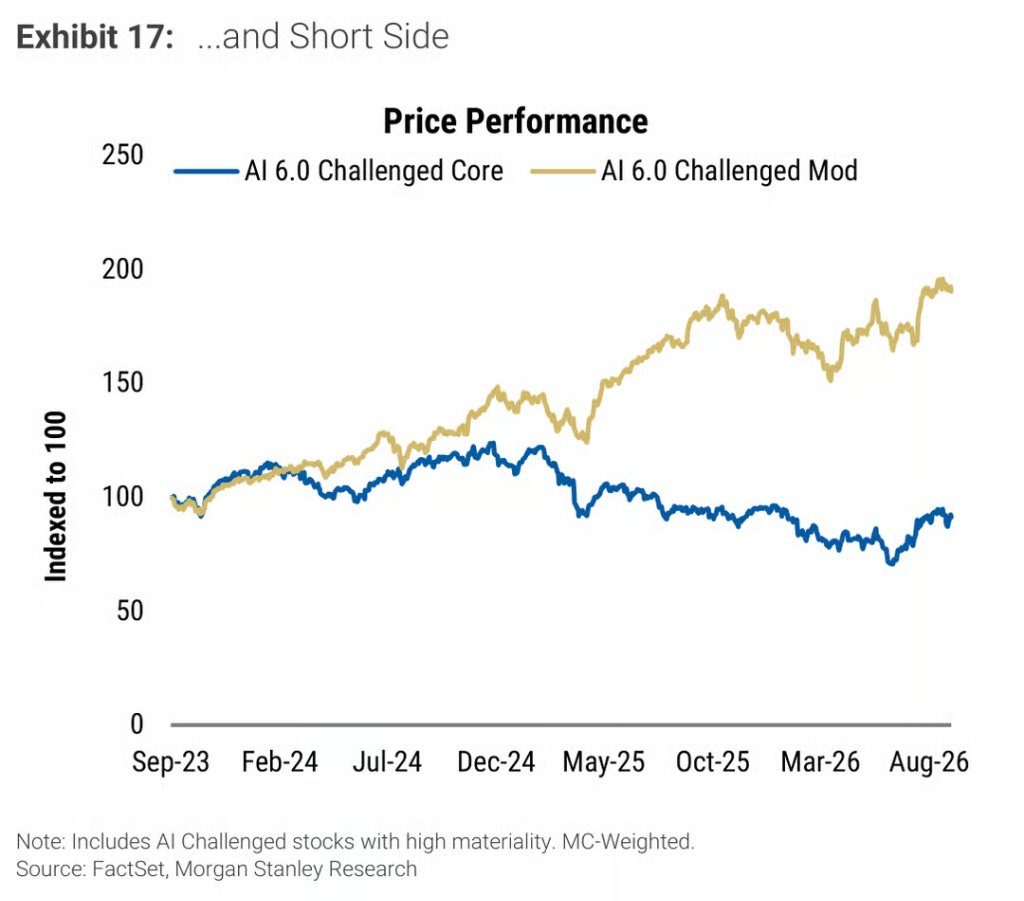
Additionally, companies where AI is "core to the investment thesis" have outperformed those where AI is "merely important" by 107%; while companies facing core AI threats have underperformed those facing moderate disruption by about 161%, indicating that the market's pricing of AI impact levels has become increasingly nuanced.