
Bitcoin Bottoming in Progress: Geopolitical Premium Fading, Patient Capital Entering
- Core View: After Bitcoin fell to $60,000, although the market is still in an on-chain bear market zone, improvements in spot liquidity, increased passive buying, and the normalization of options market volatility indicate that selling pressure is being absorbed more efficiently. The market may be forming a bottom supported by patient capital.
- Key Elements:
- Bitcoin is trading at a 15% discount to the Real Market Mean ($77,200), confirming on-chain metrics indicate a bear market zone. The short-term holder MVRV has recovered to 0.90 but remains below the 1.0 breakeven line, with this cohort holding an average unrealized loss of approximately 10%.
- Realized Market Cap has contracted by 1.45% over the past 90 days to $1.07 trillion, but the 7-day change is near stagnation (-0.18%). The slowdown in capital outflows is one of the key conditions for transitioning to the pre-bull market phase.
- The bid depth of the Spot Order Book has rebounded to its most abundant level in recent months, with passive buy orders absorbing supply at lower prices, reducing reliance on aggressive buyers. This indicates selling pressure is being absorbed more efficiently.
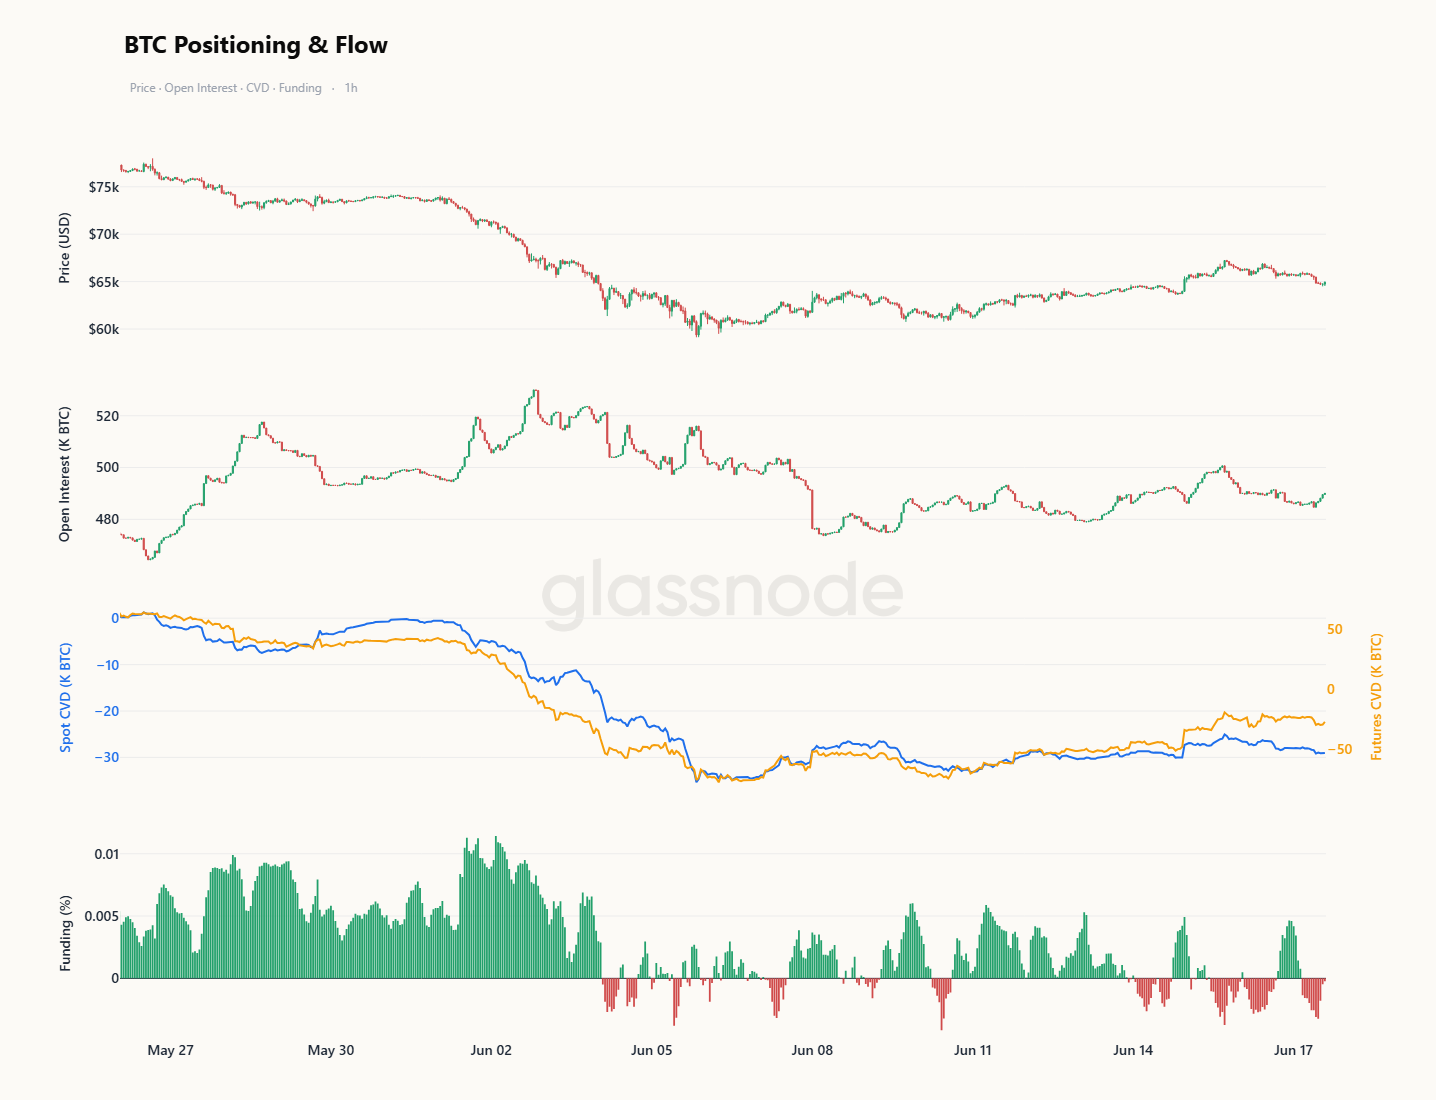
- Open Interest remains at low levels, with demand for futures leverage weak. Spot CVD exhibits a gentle downward trend, reflecting a quiet accumulation behavior lacking aggressiveness, rather than an influx of capital eager to enter the market.
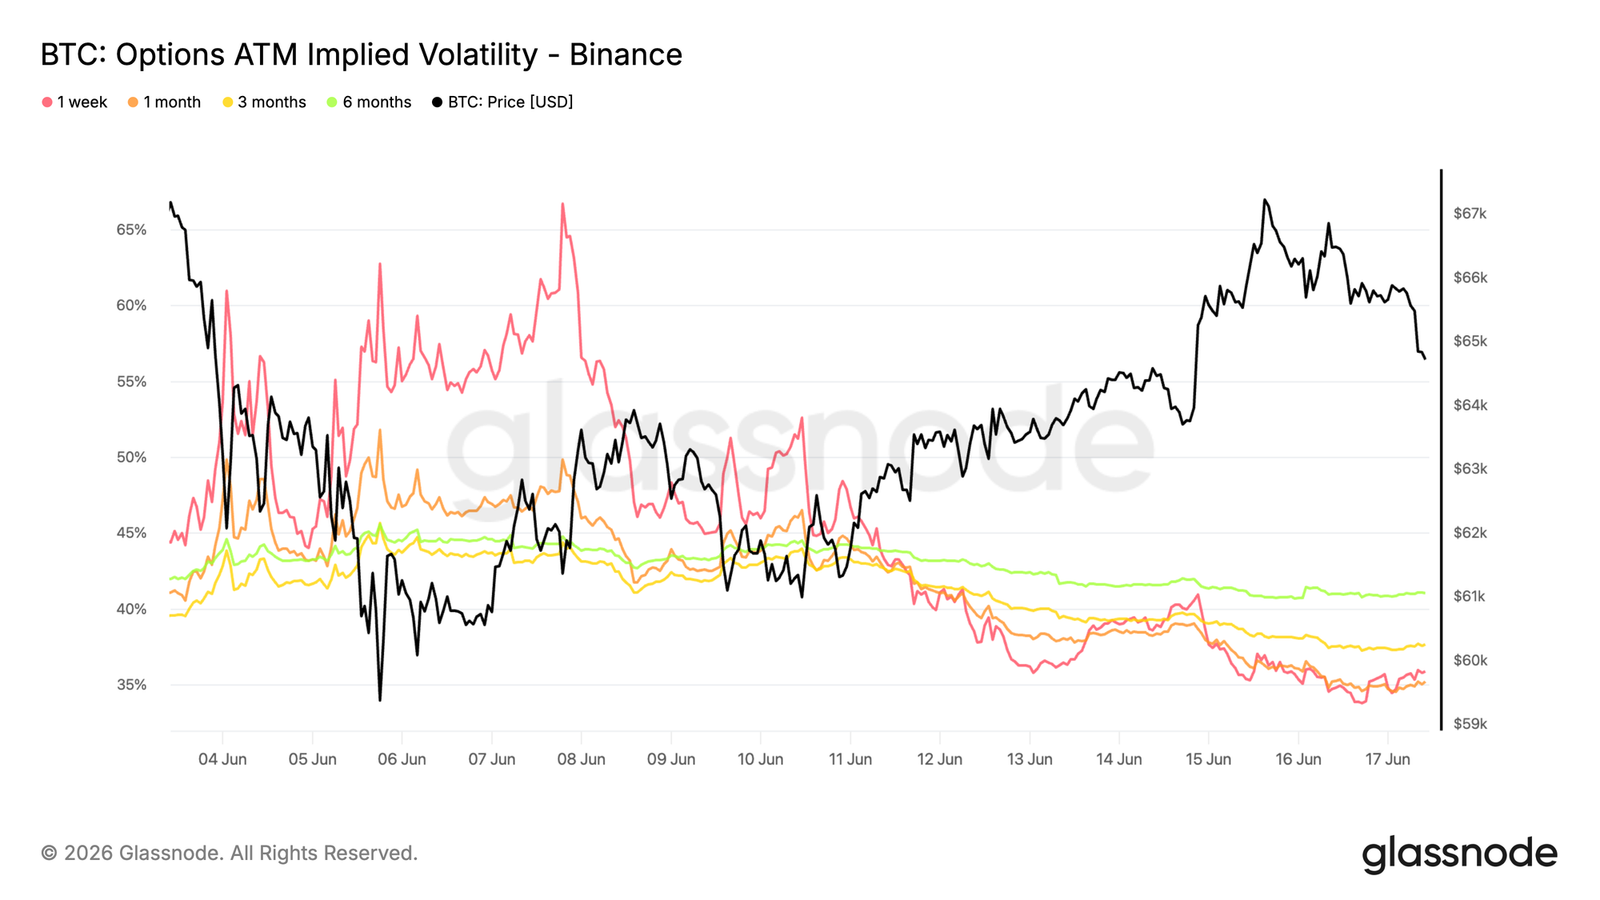
- Implied Volatility has significantly normalized (the 1-week tenor falling from 65% to approximately 35%), but Realized Volatility continues to climb to 42%, pushing the Volatility Risk Premium into negative territory, suggesting the options market anticipates a calmer period ahead.
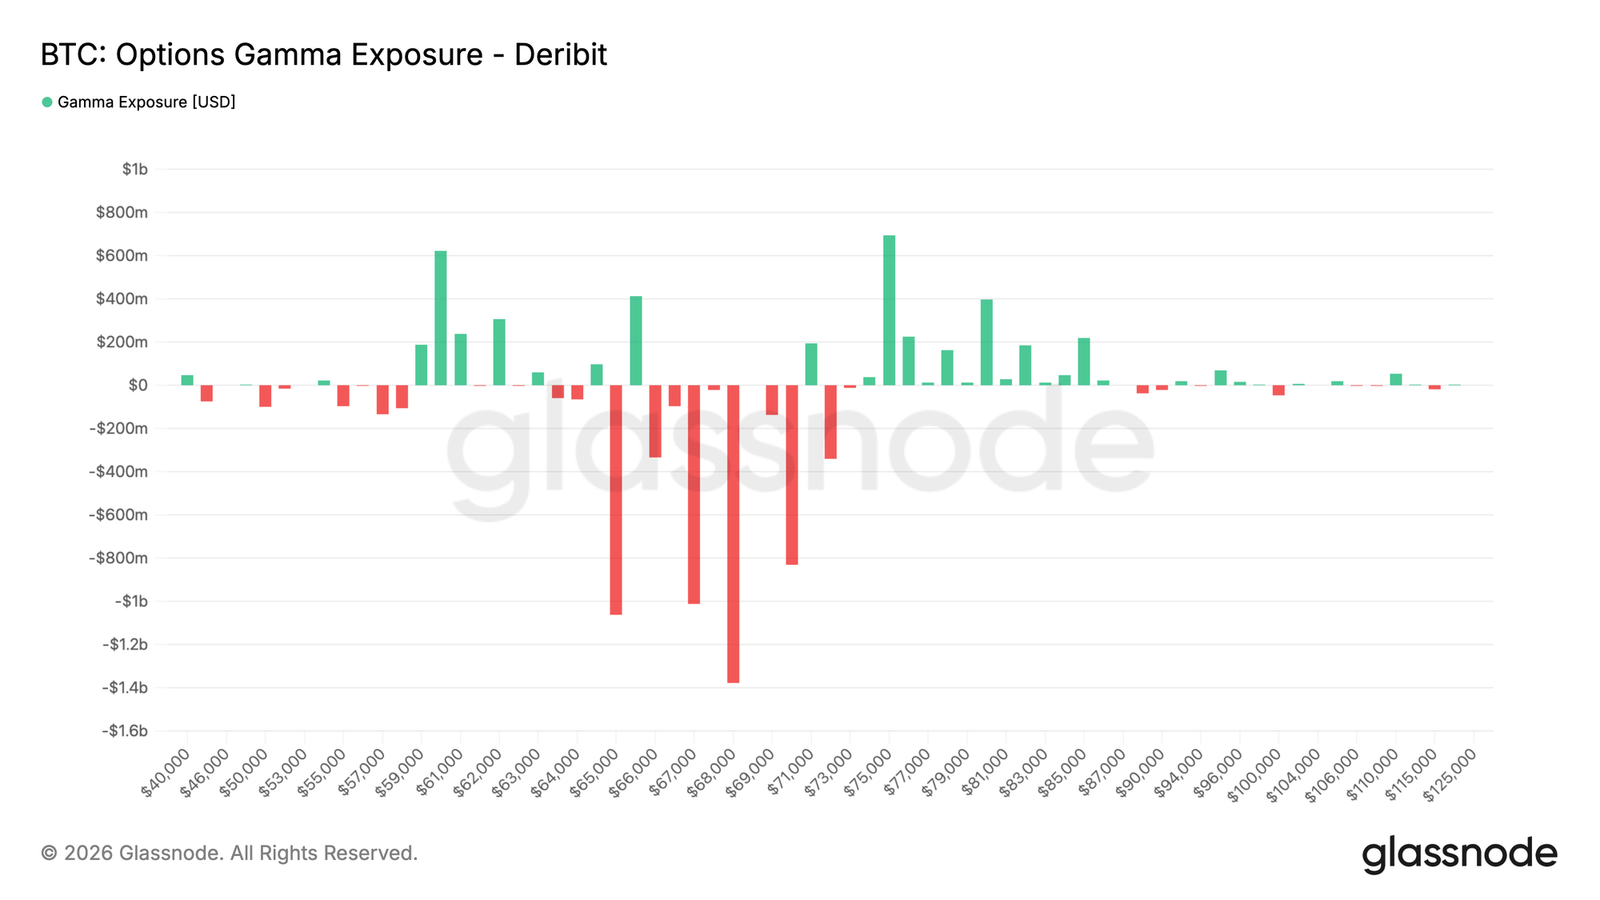
- The 25 Delta Skew has retreated from recent extreme levels (the 1-week tenor dropping to around 13%), indicating a significant easing in demand for downside protection. Market makers' negative Gamma exposure is concentrated around the $68,000 level, with spot prices slightly below this zone.
Original Author: Glassnode
Original Translation: AididiaoJP, Foresight News
Bitcoin's drop toward $60,000 has widened losses, putting recent buyers under pressure. However, improving liquidity, strengthening passive buying, and the patience shown by ETF holders suggest the market may be forming a bottom.
Summary
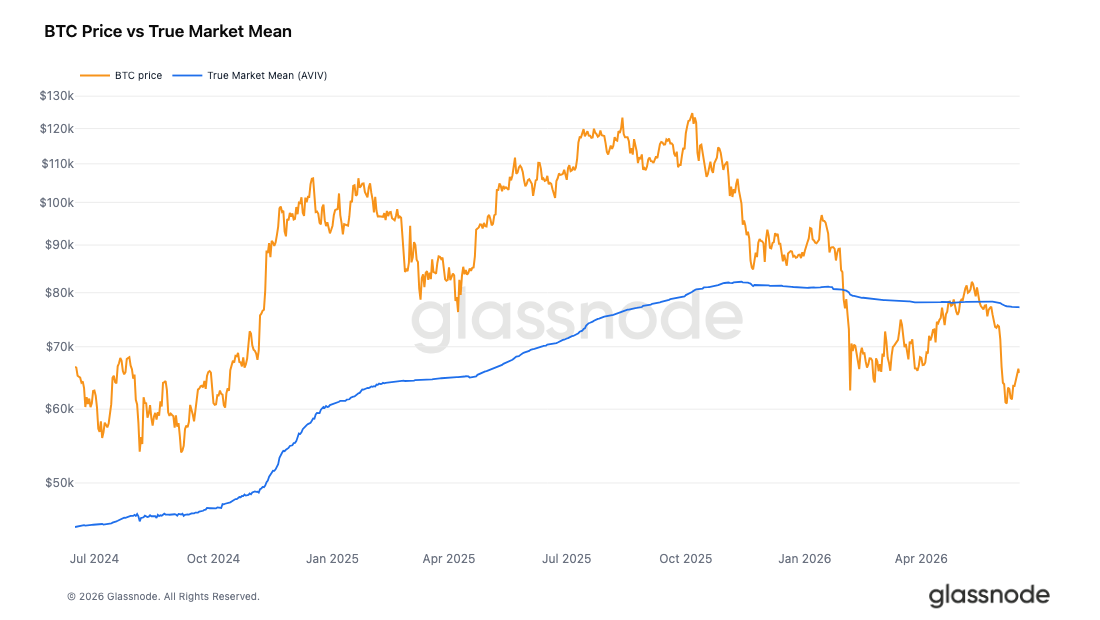
- Bitcoin is trading at a 15% discount to the True Market Mean of $77,200, confirming it remains in a bear market zone on-chain, despite a post-truce bounce and the removal of geopolitical risk premiums.
- The Short-Term Holder MVRV has recovered from 0.81 to 0.90 but remains below the 1.0 breakeven level. The 30-day SMA of the realized profit/loss ratio at 0.53 confirms that loss realization continues to dominate capital flows.
- Realized Cap has contracted by 1.45% over the past 90 days to $1.07 trillion, but the 7-day change has nearly stalled at -0.18%. Returning to positive growth and reclaiming the True Market Mean are key conditions for a credible transition to a pre-bull phase.
- Spot liquidity conditions have improved. Passive bid depth has risen after Bitcoin's drop toward $60,000, reducing reliance on aggressive buyers and suggesting sell pressure is being absorbed more efficiently.
- Total open interest remains low, but large passive bids continue to absorb supply while aggressive selling subsides, pointing to a more patient buyer base providing support at current levels.
- Implied volatility has normalized significantly, while realized volatility continues to rise, pushing the volatility risk premium into negative territory.
- Skew has retreated from recent extremes, indicating a notable easing in demand for downside protection.
- Options flow is becoming more balanced, but dealer positioning remains concentrated in the negative gamma zone at $68,000.
Macro Insights
Bitcoin's May-June decline was a war premium event. In the first three weeks, BTC fell approximately 22% from $77,486 to a low of $60,861, while WTI crude oil held above $90 and gold rallied on safe-haven demand. A classic geopolitical/stagflationary play.
The US-Iran peace agreement announced on June 14 broke this pattern within just 48 hours. Crude oil crashed from $86 to $76, and gold's safe-haven premium faded. BTC, after its bounce, reclaimed the $65,000-$66,000 range it had lost during the earlier decline.
Crude oil's percentage move far exceeded other assets, and this is the key takeaway. The energy and geopolitical premium that had been suppressing risk assets over the past three weeks has been removed. Gold is the only one of the three assets near its starting level. Both BTC and crude are trading below their pre-shock ranges, but for opposite reasons: crude is repricing real demand prospects, while BTC is repricing the absence of headwinds.
With the geopolitical risk premium unwinding, the conditions pushing capital toward safe havens and away from risk assets are easing. Historically, this rotation has been positive for BTC.
On-Chain Insights
Below the Market Mean
As the geopolitical risk premium unwinds following the US-Iran peace agreement, with crude oil falling from $86 to $76, the macro headwinds that have recently been suppressing risk assets are easing. This backdrop provides an opportunity to reassess Bitcoin's position within its own cyclical rhythm (assuming the structural patterns of prior cycles remain valid).
The clearest metric to distinguish structural bull and bear markets is to compare the spot price against the cost basis of the active investor cohort. The True Market Mean tracks the average acquisition price of actively traded coins and has historically served as the dividing line between bear and bull markets.
The True Market Mean currently sits at $77,200, approximately 15% above the spot price of $65,600, placing the market in a clear discount zone. The price briefly approached this level during the mid-May highs, but the subsequent correction has significantly widened the gap.
Despite the recent bounce, on-chain metrics remain firmly in bear market territory. Only a swift reclaim of the True Market Mean would trigger a shift in our overall outlook from a bear market to a potential pre-bull phase.
Recent Buyers Still Underwater
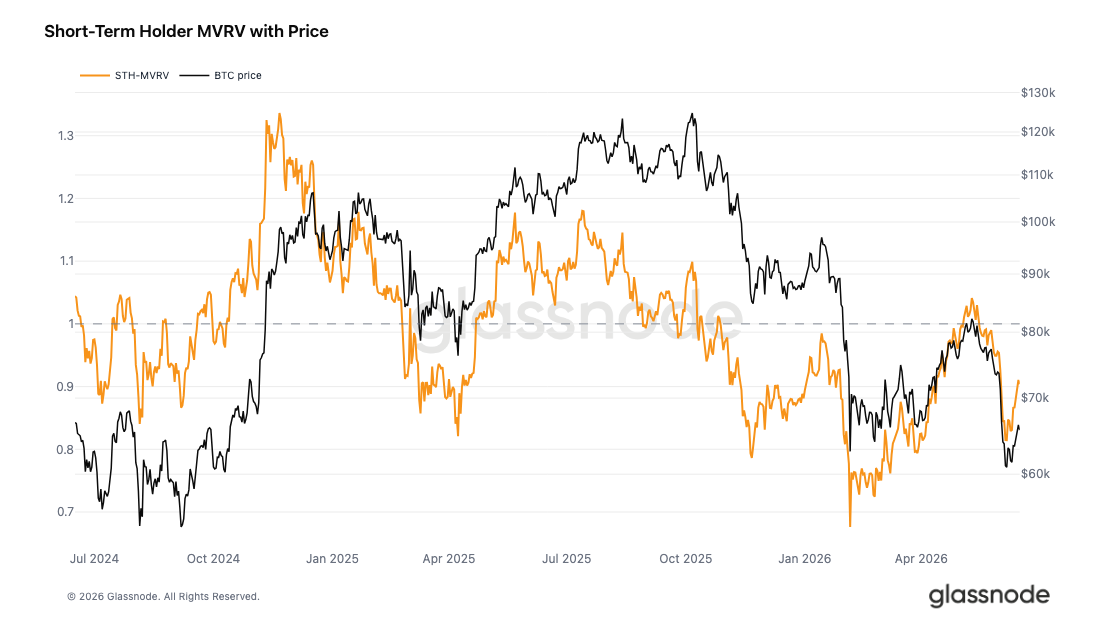
Against this backdrop of a confirmed overall bear market signaled by the sustained discount to the True Market Mean, the next question is: How are the new entrants faring after the bounce from the early June lows? The Short-Term Holder MVRV measures the aggregate unrealized profit/loss of coins moved within the last 155 days, with 1.0 representing the collective breakeven point for this group.
In last week's report, this metric stood at 0.83, indicating deep losses for new buyers. It has since recovered to 0.90 following the price bounce from the lows but remains below the critical 1.0 threshold. The implied cost basis for this cohort is approximately $72,600, meaning they are still holding an average unrealized loss of about 10%.
While the recent rebound has provided some relief, it has not been sufficient to return this group to aggregate profitability—a prerequisite for exiting bear market conditions. The move from 0.81 to 0.90 has eased pressure on recent buyers but hasn't resolved it. Until the STH MVRV reclaims 1.0, this cohort remains a potential source of sell pressure during any rally attempts.
Losses Still Dominate Flows
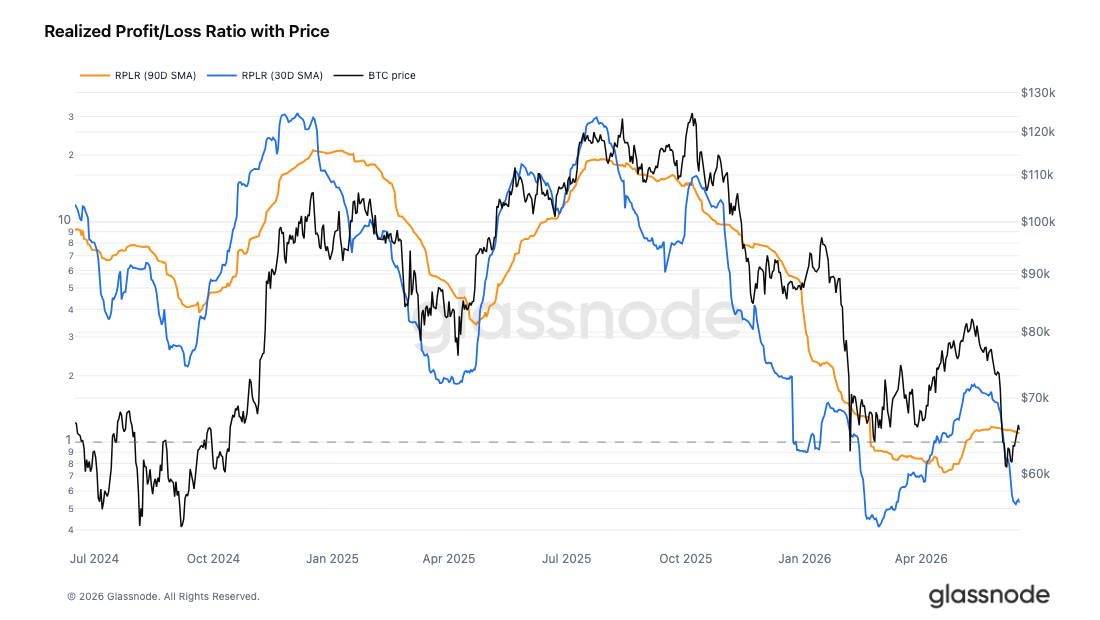
Further corroborating the bear market framework and the recent rally's inability to push STH MVRV back to breakeven, the overall market profitability also points to the same conclusion. The Realized Profit/Loss Ratio compares the USD value of profitable coins against those moved at a loss. A value above 1 indicates profit-taking is dominant, while below 1 reflects loss realization as the prevailing force.
The 90-day SMA of this ratio is currently 1.10, well below the four-year average and only slightly above the neutral line of 1.0, suggesting market indecision on a quarterly smoothed basis. The 30-day SMA, however, is more decisive at just 0.53, confirming that loss realization has significantly outpaced profit-taking over the past month.
This capital flow configuration—with the 90-day SMA hovering near 1.0 and the 30-day SMA at 0.53—firmly confirms the current bear market. Only a sustained recovery of both SMAs to the bull market zone above 2 would represent the first meaningful signal of a shift in underlying preference.
Capital Is Quietly Exiting
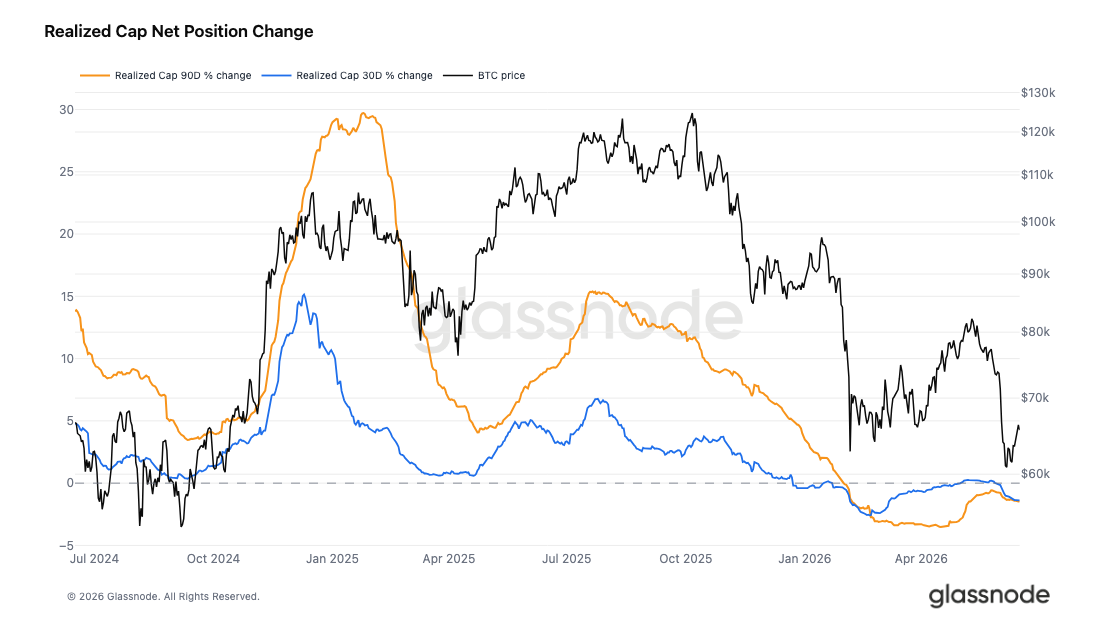
Measuring profitability preferences via the Realized Profit/Loss Ratio is only half the picture of capital flows; the scale provides the complete view. Realized Cap measures the aggregate cost basis of all coins in circulation, rising as capital flows into the network and falling as it exits. Currently standing at $1.07 trillion, Realized Cap has contracted by 1.45% over the past 90 days, with a 30-day change of -1.39%. This reflects a sustained, cyclical capital outflow rather than a single, sharp shock.
A faintly positive signal from the recent rebound is that the 7-day change has nearly stalled at -0.18%. The cyclical contraction in Realized Cap corroborates the bearish assessment established by the valuation and flow metrics above, indicating a deep bear market where valuation discounts align with capital outflows.
The specific, measurable conditions required for a credible transition to a pre-bull phase are: reclaiming the True Market Mean near $77,200, the Short-Term Holder MVRV returning above 1.0, and the 90-day Realized Cap turning to positive growth.
Off-Chain Insights
Spot Liquidity Turns Supportive
Spot market conditions have started to improve following Bitcoin's drop into the $60,000 range. The depth imbalance on the Binance spot order book has noticeably shifted to the bid side. Buyer liquidity currently exceeds the resting sell orders, reaching its most ample level in recent months.
This suggests market participants are increasingly inclined to absorb supply at lower prices rather than providing liquidity during bounces. While order book liquidity is inherently dynamic and can be quickly withdrawn, this recent shift marks a significant change from the sell-side dominance seen during the earlier decline.
Historically, sustained bid dominance often accompanies periods of market stabilization, as deeper bid walls provide support below the price and enhance the market's ability to absorb further sell pressure.
While not sufficient on its own to confirm a bottom, the emergence of strong bid depth indicates that spot market participants are becoming increasingly willing to defend current price levels.
Patient Buying, No Aggression
Open Interest was in a recent high range at the end of May, providing funding to push local highs. When the price broke down in early June, both spot CVD and futures CVD turned negative simultaneously, indicating selling by both real capital and leveraged participants, rather than just a unilateral long-squeeze. Subsequently, open interest compressed significantly from its high, confirming a genuine deleveraging event. Funding rates retreated from clearly positive levels to oscillate near zero, reflecting neither a crowded long premium nor aggressive short bias.
Since the shakeout, open interest has barely recovered, so the modest uptick in futures CVD reflects only weak demand for leverage. Spot CVD has not followed suit, remaining flat to declining. However, this is precisely the characteristic of the resting limit bid orders discussed earlier. Passive orders absorb supply below the spread, which can keep spot CVD appearing bearish even as coins are being sold, a feature sustained by continuously replenished bids. This accumulation is quiet and lacks aggression.
Only a sustained upward turn in spot CVD would indicate that real buyers are becoming eager to enter quickly rather than patiently placing limit orders. If this signal were to align with the currently subdued futures signal by turning higher, it would form a constructive configuration of dual upward alignment in capital flows.
Implied Volatility Continues to Normalize
In terms of implied volatility, the sharp repricing triggered by Bitcoin's breakdown from its multi-month range is steadily unwinding as the spot price stabilizes around $65,000 and bounces from the June lows.
The adjustment has been most dramatic on the front end. One-week ATM implied volatility has retreated from a peak above 65% to around 35%, while the one-month tenor has fallen from approximately 50% to 35%. Longer tenors have adjusted less, with the six-month tenor declining from about 44% to 41%.
This decline reflects the market's growing comfort with the current price environment. Despite Bitcoin rallying from the June low near $59,000 back towards $67,000, options demand continues to decline across tenors, as traders unwind the protection premium built during the sell-off.
The volatility shock has largely been absorbed, and the options market is steadily removing the premium that was priced in during the recent period of stress.
Volatility Risk Premium Turns Negative
With implied volatility normalizing, the relationship between implied and realized volatility has shifted significantly over the past week.
One-month implied volatility has fallen from around 47% to 35%, while realized volatility has continued to climb, rising from approximately 27% to 42%. The result has been a substantial compression of the volatility risk premium, moving from a double-digit premium in early June into negative territory.
The chart shows that the volatility premium built during the sell-pressure phase has been steadily unwound. As implied volatility normalizes, the recent market turbulence has been captured by realized volatility, compressing the spread and eventually turning it negative.
Realized volatility is now higher than implied volatility, a complete reversal of the situation in early June.
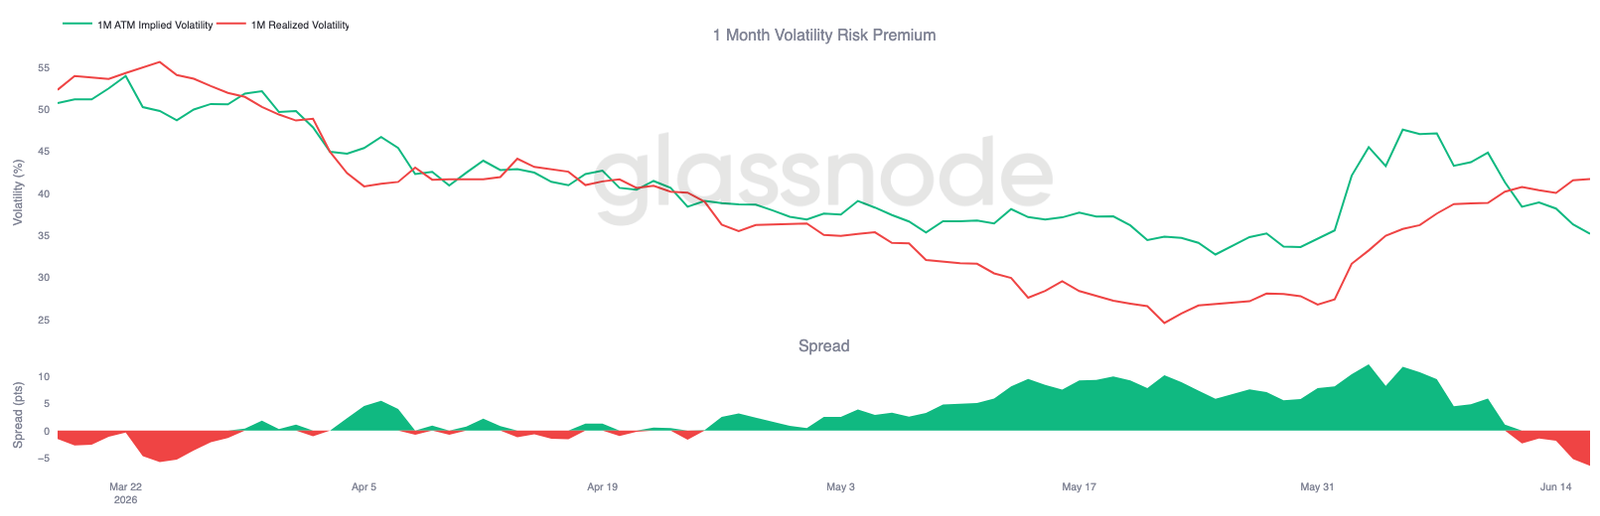
The volatility risk premium turning negative indicates that the options market is currently pricing in a calmer environment than what recent price action suggests.
25 Delta Skew Normalizes After Protection Wave
With the volatility risk premium reversing, skew provides a view into how directional protection demand has evolved since the sell-pressure began.
Skew is calculated as put volatility minus call volatility. A positive value indicates puts are trading at a premium relative to comparable calls. Earlier this month, downside protection became significantly more expensive, with one-week skew briefly approaching 30% and the one-month tenor rising above 24%, as traders rushed to hedge against a drop to the June lows.
This demand has now eased. One-week skew has retreated to around 13%, and the one-month tenor has fallen to approximately 14%. Longer tenors have also normalized, with three-month and six-month skew currently around 13% and 11%, respectively.
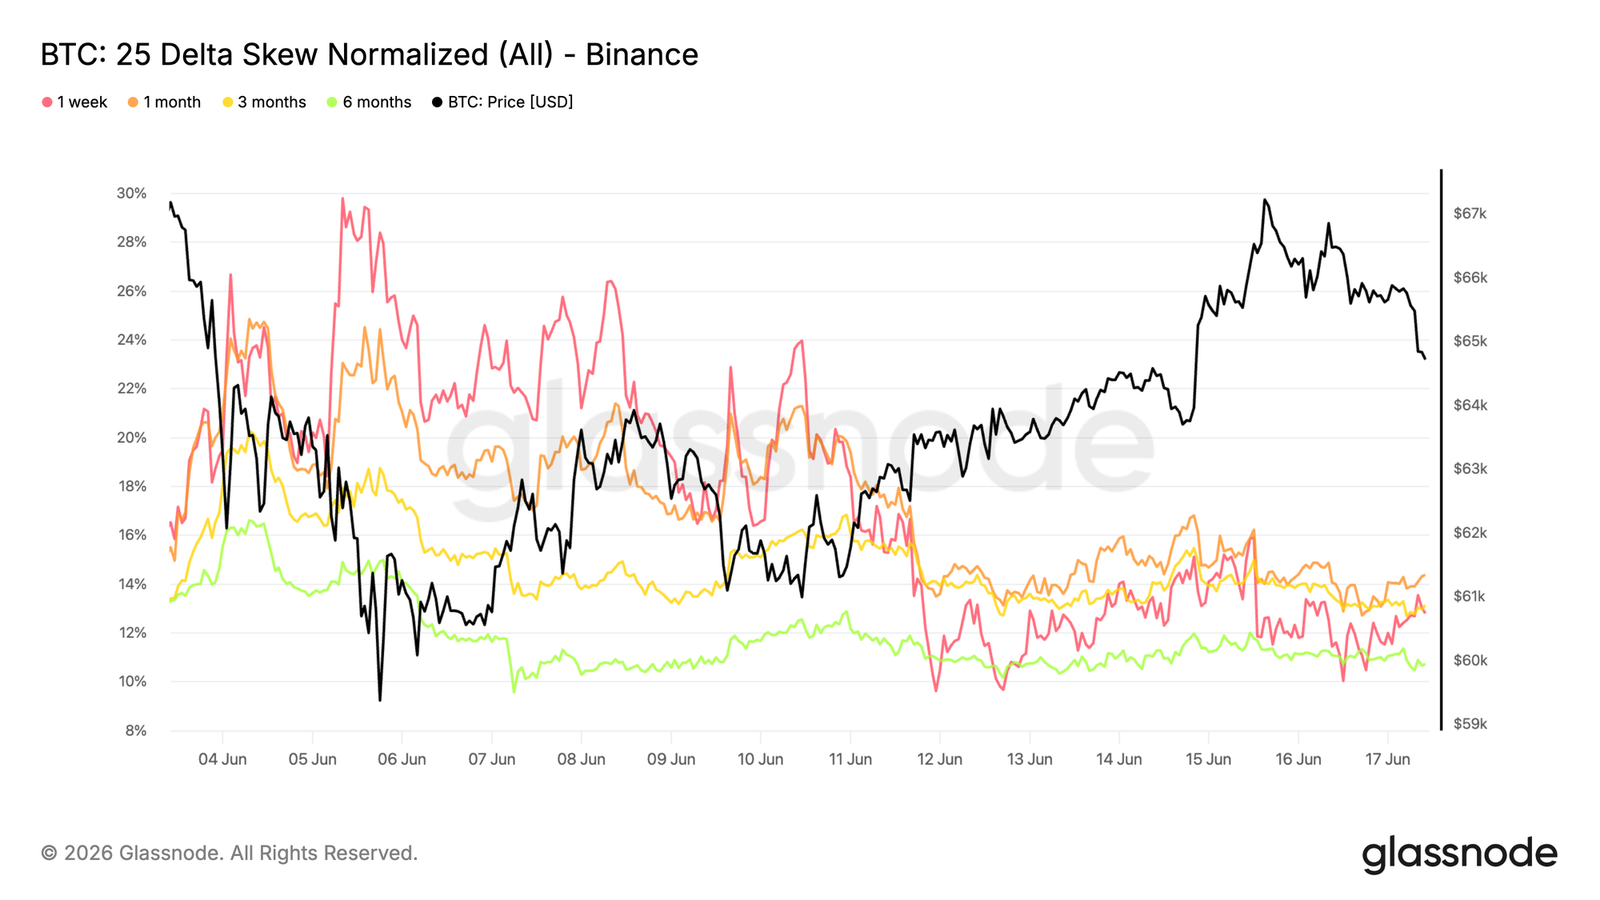
Protection demand remains higher than pre-sell-pressure levels, but the acute wave of downside hedging has largely subsided as market conditions stabilize.
Gamma Exposure Concentrated Above Current Spot
Beyond pricing and sentiment, gamma exposure helps identify the strike levels where dealer hedging activity might have the most significant impact on market dynamics.
Recent options flow has become more balanced. Over the past seven days, put buying accounted for the largest share of traded premium at 28.1%, followed closely by call buying at 24.1%. In the last 24 hours, call buying has slightly exceeded put buying.
This evolution is reflected in the gamma profile. The largest negative gamma cluster is currently located at $68,000, with short gamma exposure extending from $66,000 to $71,000. With Bitcoin currently trading near $65,000, the spot price remains just below the main concentration of short gamma. Positive gamma exposure is situated much higher, in the high $70,000 range, meaning Bitcoin is still some distance from the nearest stable dealer positioning zone.
As protection demand normalizes, dealer positioning remains concentrated above the current spot price, with the largest negative gamma zone centered around $68,000.
Conclusion
Bitcoin remains in a corrective phase, but market characteristics are beginning to shift. While profitability has deteriorated, realized losses have accelerated, and recent buyers remain stressed, several indicators suggest the market is transitioning from forced selling towards stabilization.
Liquidity conditions are improving. Spot order books are rebuilding, and passive buyers are becoming more active. Simultaneously, ETF holders continue to demonstrate relatively firm conviction, extending their holding periods rather than aggressively reducing positions. The options market remains cautious, with demand for downside protection still present, but volatility expectations have retreated from their recent elevated levels.
The result is a market that remains fragile but is increasingly supported by patient capital. Whether Bitcoin can establish a durable bottom near current price levels will likely depend on whether improving liquidity and selective accumulation can outweigh persistent earnings weakness and broader risk sentiment.


