
Bitcoin Bull Trap Early Warning, Bearish Logic Continues to Deliver Profits | Guest Analysis
- Core View: The report maintains its core judgment of a bearish trend in the Bitcoin market, believing that the rebound from the February low (Wave C-2) is nearing its end, with subsequent risks of a Wave C-3 correction. A detailed trading strategy has been formulated based on this framework.
- Key Elements:
- Market Validation: Bitcoin failed to break through resistance last week and experienced a pullback, validating the previous judgment of the market being in a "bull trap" and a bearish trend.
- BTC Structure Analysis: The current uptrend is considered a Wave C-2 rebound within a larger corrective wave. A break below the support around $60,000 would confirm the establishment of a Wave C-3 correction, targeting lower levels.
- HYPE's Independent Trend: HYPE exhibits an independent three-wave upward structure, currently in a correction phase after the main Wave III surge. However, caution is needed regarding the risk of being dragged down by Bitcoin's overall weakness.
- Trading Strategy: Maintain a medium-term position of 60% Bitcoin short established at higher levels. For short-term trading, it is suggested to use 30% of capital for flexible spread trading around key resistance and support levels.
- Trade Review: Last week, based on quantitative model signals, successful short-term trades were executed: a HYPE long position (profit 4.41%) and a BTC short position (profit 5.37%).
- Risk Management: Emphasizes strict adherence to stop-loss discipline and provides specific rules for dynamic trailing stops from entry to profit-taking.
In last week's report, we clearly indicated that the market was in a bull trap zone, advised investors against blindly chasing rallies to add positions, and maintained our bearish trend outlook. This week's market movements provided clear validation — Bitcoin failed to effectively break through the resistance zone and subsequently experienced a significant pullback, with the bearish logic continuing to hold.
The following sections will present this week's market forecast, operational strategy suggestions, and a review of last week's trade executions to help readers navigate direction and make precise decisions in a complex market.
Core Summary of the Trading Weekly Report:
• HYPE Short-term Trading Performance: Completed one short-term long position (1x leverage) last week, successfully achieving a profit of approximately 4.41%. (Details in Part Two)
• BTC Short-term Trading Performance: Completed one short-term short position (1x leverage) last week, successfully achieving a profit of approximately 5.37%. (Details in Part Four)
• HYPE This Week's Forecast and Operational Strategy: See Parts One and Two for details.
• BTC Market Trend Forecast and Medium/Short-term Operational Strategies: See Parts Three and Four for details.
• Core View Validation: Bitcoin remained in a bearish trend structure last week, with price action fully aligning with our forecast; the bull trap warning was effectively realized.
I. HYPE Forecast and Operational Strategy
1. This Week's Core View:
Based on the current structure, we assess that the hourly-level downward correction initiated from the March 19th high (near endpoint 27) is likely to conclude soon. Subsequent price action needs to observe whether the price can effectively break free from the range constraint of Central C to confirm if the correction has truly ended. An effective breakout would further clarify the signal for trend continuation. The probability of a wide-range consolidation is high for this week, and operations should remain flexible.
2. HYPE Upside Risk Warning:
It is important to note that while HYPE's price action exhibits independence, it cannot completely detach from Bitcoin's broader environment. If Bitcoin's trend shows a significant adjustment later, it could potentially drag down HYPE's rebound momentum. Investors must remain vigilant and have risk contingency plans in place.
3. This Week's Operational Strategy:
Utilize 30% of the position, set stop-loss points, and look for "spread" trading opportunities based on support and resistance levels (using 30-minute/60-minute as the operational timeframe). Operations should be light, flexible, and strictly adhere to stop-loss discipline.
II. HYPE Last Week's Structure Analysis and Short-term Operation Review
1. Continuous Tracking of HYPE Market Dynamics and Investment Opportunities
Since late February, we have continuously tracked and analyzed HYPE, with each previous judgment effectively validated by market movements. A specific review is as follows:
• February 23rd Weekly Review: First hinted that HYPE might be entering an investment window, pointing out that the market was in a Wave II correction phase and forecasting a potential initiation of the Wave III main uptrend thereafter.
• March 3rd Weekly Review: Determined that the February 24th low of $25.60 could be the starting point for Wave III, confirming the potential location for a trend shift.
• March 9th Weekly Review: Noted that the price had effectively broken through multiple moving average resistances on the daily chart, subsequently entering a consolidation phase, with an expectation of rapid upward movement after its conclusion.
• March 16th Weekly Review: Indicated that the market was within the Wave III uptrend, constructing an upward central pivot (Central B). Forecasted a high probability of wide-range consolidation after its completion.
2. Overview of HYPE Daily Chart Structure (Based on price evolution after January 21st):
The current HYPE daily chart clearly shows a three-wave progression pattern, with the characteristics of each sub-wave as follows:
• Wave I (Impulse Wave): From the January 21st low of $20.46 to the February 3rd high of $38.41, lasting 14 days, with a maximum gain of 87.73%, demonstrating strong driving force.
• Wave II (Corrective Wave): From the February 3rd high of $38.41 to the February 24th low of $25.60, lasting 20 days, with a maximum decline of 33.35%, a normal retracement range.
• Wave III (Main Uptrend Wave): From the February 24th low of $25.60 to the present, the market has run for 27 days, with a maximum gain of 71.02%. The main uptrend continues, with good structural integrity.
3. HYPE Hourly-level Sub-structure (Based on price action after March 16th):
HYPE_60-minute K-line Chart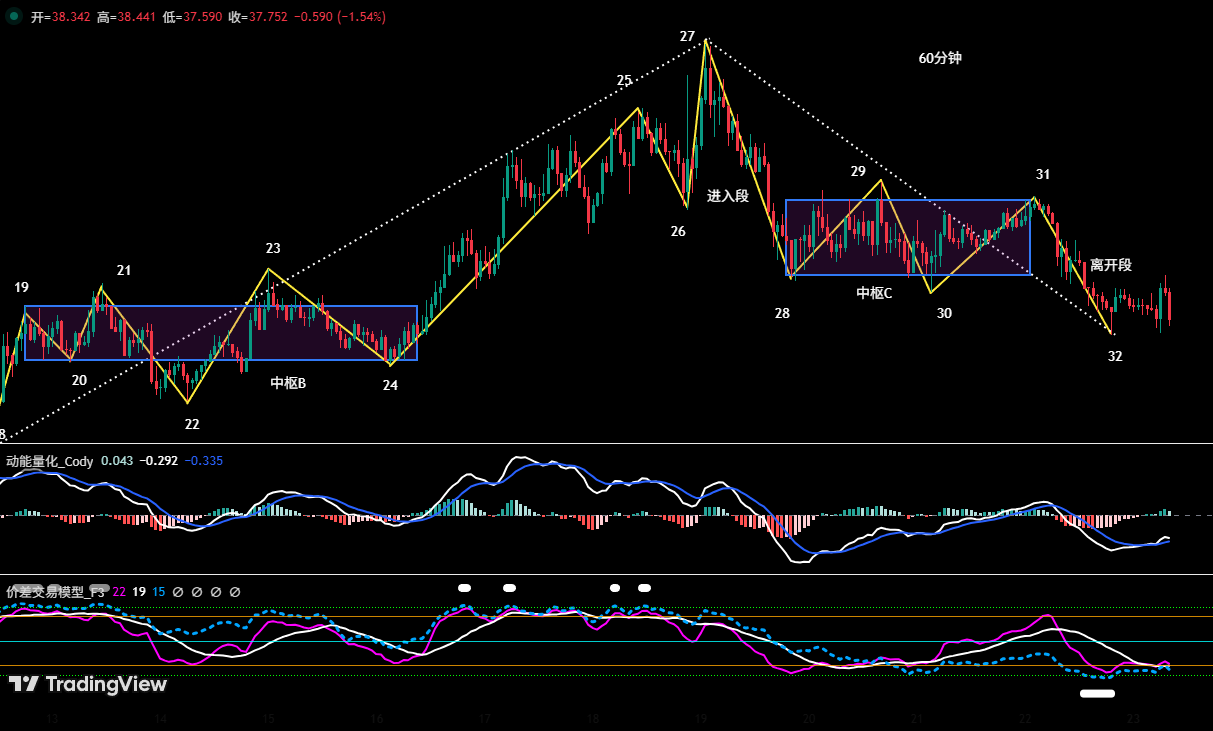
Figure 1
• HYPE Hourly-level Structure Review: As shown in the chart, the price was constructing an upward central pivot (Central B) during the period from the 9th to the latter half of the 15th, nearing completion, with the overall rhythm aligning with our previous forecast.
• HYPE Hourly-level Internal Structure Division (03.16~03.22):
a. As shown in (Figure 1), starting from endpoint 24, the previously constructed upward central pivot (Central B) is confirmed to be complete. Subsequently, the market evolved into a complex structure consisting of 8 segments: 24-25, 25-26, 26-27, 27-28, 28-29, 29-30, 30-31, 31-32. At the time of analysis, segment 31-32 was in progress, with a relatively clear structural hierarchy.
b. Segments 24-25, 25-26, 26-27 constitute an upward structure with a relatively clear directional bias.
c. Segments 27-28, 28-29, 29-30, 30-31, 31-32 constitute a corrective structure, with the adjustment process showing clear oscillatory convergence characteristics.
d. Among them, segments 28-29, 29-30, 30-31 overlap with each other, jointly constructing a downward central pivot (Central C), which is the core range of this correction.
4. HYPE Short-term Operation Review (1x Leverage) (03.16~03.22):
Last week, based on trading signals from our self-constructed spread trading model and momentum quantification model, combined with the forecast for the upward structure, we completed one short-term (long) operation, successfully profiting 4.41%. The execution strictly followed the plan.
• Summary of HYPE Short-term Trade Details (Leverage×1):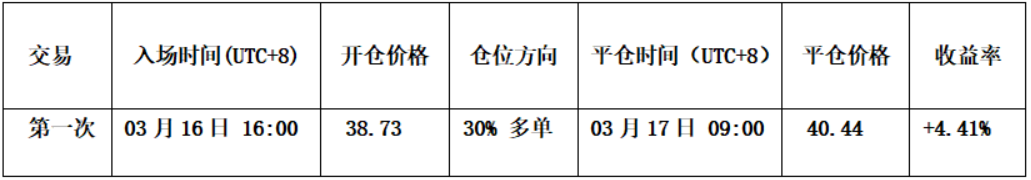
• Entry Decision: This entry decision was based on the forecast for trend continuation after the completion of upward central pivot B. The specific trigger signal was the price effectively breaking through the central pivot upper resistance (around $38.54), with both the spread and momentum quantification models issuing bullish resonance signals. The叠加 of multiple bases significantly improved the reliability of the entry timing. Accordingly, we executed a long position entry with 30% of the position at $38.73.
• Exit Decision: Based on the spread quantification model issuing a top bearish signal, forming a technical resonance with the K-line "strong top divergence" combination signal, top characteristics were clear. Therefore, we executed a full exit operation around $40.44, securing the profit.
• Trade Summary: This operation successfully profited approximately 4.41%. Both entry and exit points were effectively supported by model signals, indicating high-quality strategy execution.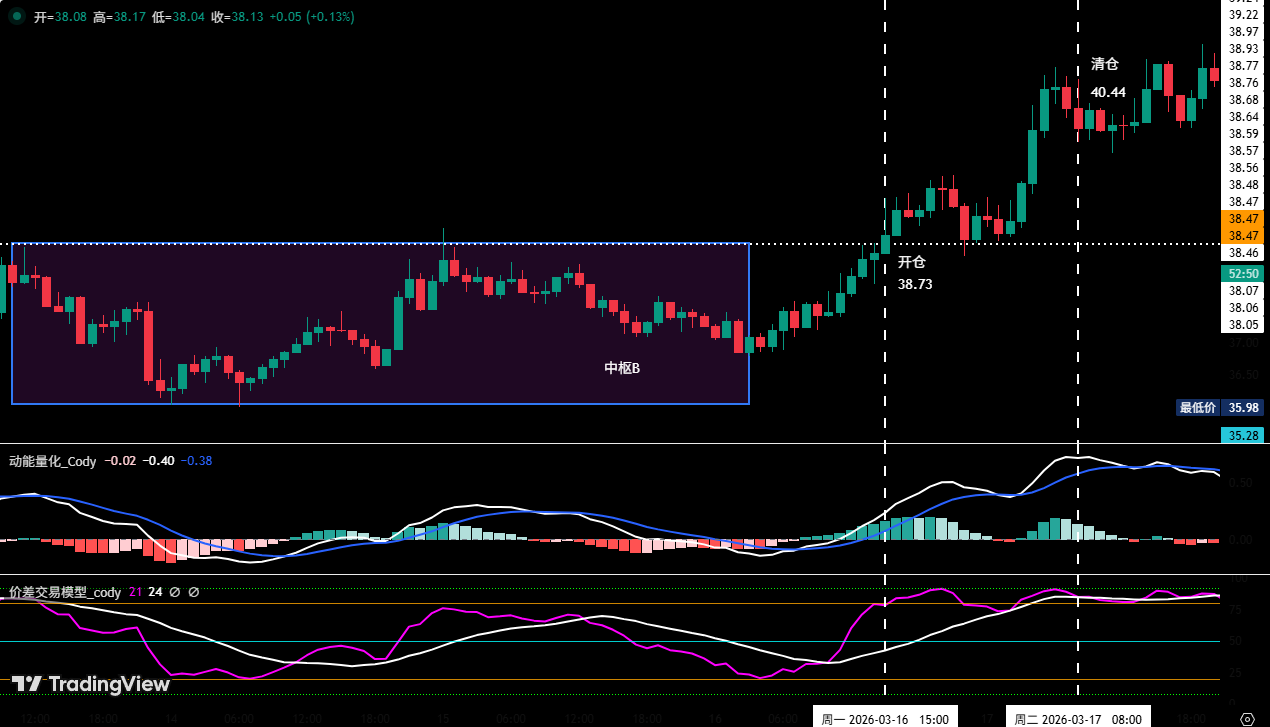
Figure 2
III. This Week's BTC Forecast and Operational Strategy (03.23~03.29)
1. Bitcoin Forecasted Structure Analysis (Based on price action after the February 6th low)
Using Bitcoin's 4-hour chart as the analysis timeframe:
• Maintain the previous core analytical framework: The uptrend initiated from the February 6th low (around $60,000) is, in nature, a oversold rebound within the larger-degree Wave C correction — specifically the C-2 wave rebound. The rebound nature determines its limited upside potential, to be followed by a C-3 wave corrective move.
• Interpretation of Current Structure: On the 4-hour chart, the short-term upward structure formed from the February 24th low has been broken. The defensive capability of bulls at key levels has significantly weakened. If the current support cannot be reclaimed, it may further test the lower rail of the ascending channel formed since the rebound from the February 6th low. Once this level is lost, the probability that our previously analyzed C-2 wave rebound ended near the recent high of $76,000 will increase significantly. The market may then retest the $60,000关口 downwards, at which point market pressure will noticeably intensify. Overall, the market remains dominated by a bearish trend structure.
• Conditions for C-3 Wave Formation: If the Bitcoin price breaks below the February 6th low (around $60,000), the C-3 corrective wave will be confirmed, reopening downside targets. Operational contingency plans must be prepared in advance.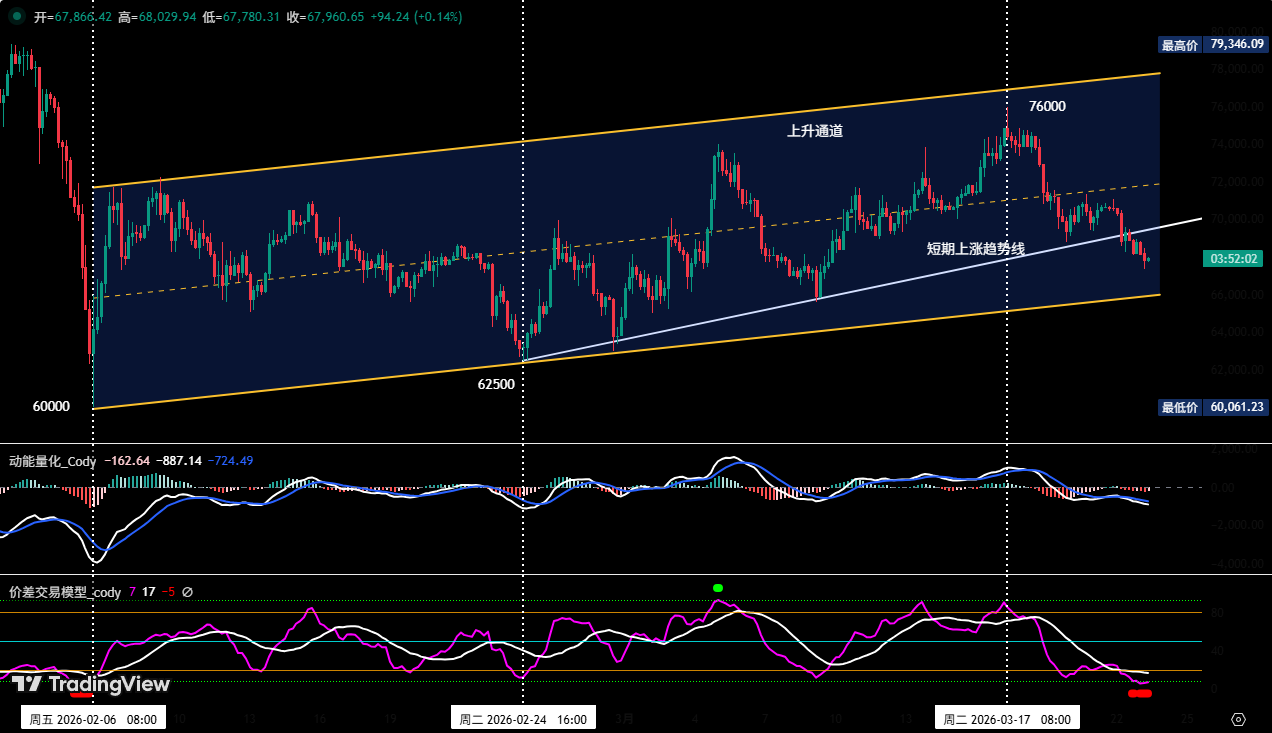
Figure 3
2. This Week's Forecast View:
Maintain the outlook for a consolidation/correction pattern. Focus on observing the battle between bulls and bears near the channel's lower rail (from the February 6th low). Volume changes and price reactions at this level will be important bases for judging the subsequent direction.
3. Core Resistance Levels:
• First Resistance Zone: $69,500~$71,500 area (previous consolidation range, main resistance band for short-term rebounds)
• Second Resistance Zone: $74,500~$76,000 area (near the November 2025 low, an important reference level for medium-term bearish strategies)
4. Core Support Levels:
• First Support Level: $65,000~$66,000 area (previous important support zone)
• Second Support Level: $60,000~$62,500 area (near the February 6th low; a breach would further strengthen the bearish structure)
• Third Support Level: Around $57,400 (an important technical reference level below)
5. This Week's Operational Strategy (Excluding Impact of Sudden News):
① Medium-term Strategy:
Bitcoin Daily K-line Chart: (Position Monitoring Model)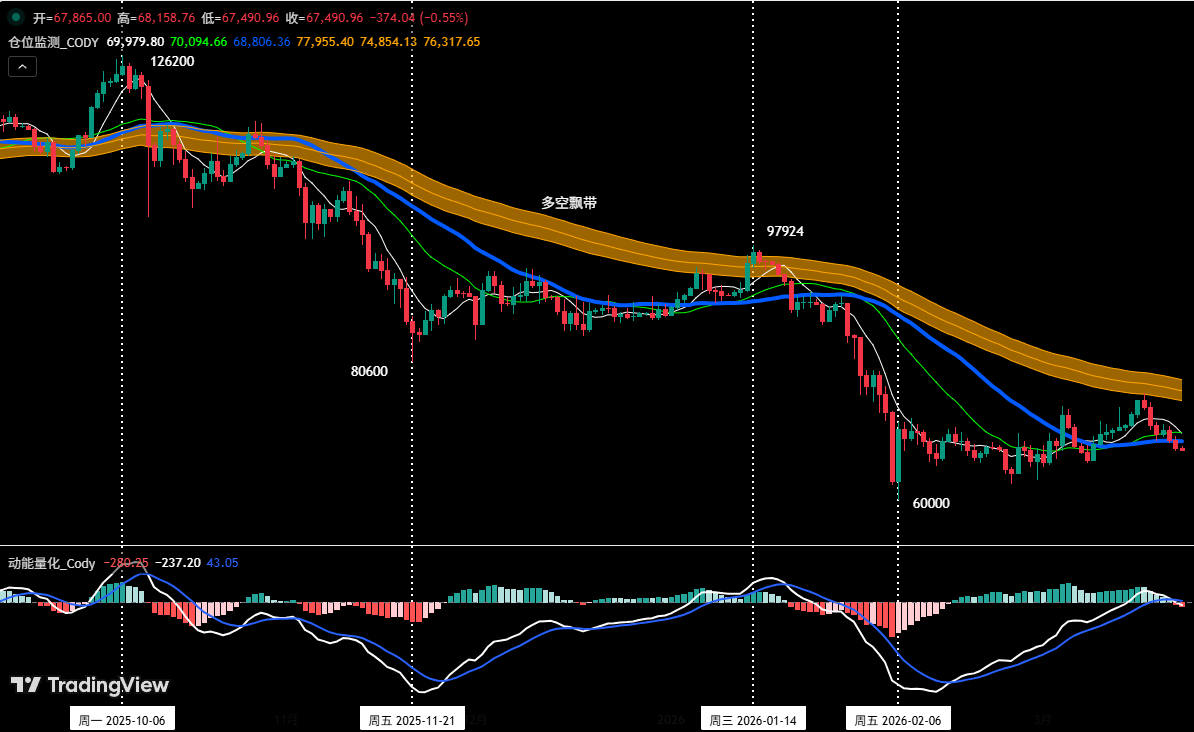
Figure 4
The Position Monitoring Model shows: The price is currently below the Bull-Bear Ribbon (yellow), and the bearish structure remains valid. According to strategy rules, we continue to hold the 60% short position established at $89,000 (January 28th), maintaining the medium-term direction unchanged.
• If the price effectively breaks above $74,500 on a rebound, reduce the medium-term position to 40% to lower risk exposure.
• If the price effectively breaks above and stabilizes above the Bull-Bear Ribbon, clear all medium-term positions, adjusting the strategy with the trend.
② Short-term Strategy:
Utilize 30% of the position, set stop-loss points, and look for "spread" trading opportunities based on support and resistance levels (using 30-minute/60-minute as the operational timeframe). Short-term operations must strictly enforce stop-loss discipline to avoid losing big for small gains.
③ Short-term Contingency Plans A/B:
Since the medium-term market direction is bearish, the operational principle of "trading with the trend by going short" should be adhered to. To dynamically respond to the market's complex evolution and combined with signals from our self-built trading models, we have formulated two short-term operational contingency plans, A and B, for live trading reference:
• Plan A: Sell on rallies encountering resistance.
Targeting scenarios where rebound momentum is limited and resistance levels are clearly encountered. Specific execution is as follows:
• Entry: When the price rebounds to the $69,500~$71,500 zone and triggers a resistance signal, combined with a model top signal, a 15% short position can be established.
• Add: If the price continues to rebound and encounters resistance in the $74,500~$76,000 zone, an additional 15% short position can be added, building the position in batches to control average cost.
• Risk Control: Initial stop-loss for both short entries is set above $77,000, strictly enforced with no flexibility.
• Exit: When the price falls near important support levels, combined with model signals, gradually close positions to realize profits, avoiding the risk of missing out by closing all at once.
• Plan B: Trend-following breakdown short.
Targeting scenarios where the price continues to decline with a structural breakdown. Specific execution is as follows:
• Entry: When the price continues to adjust and breaks below the channel's lower rail, then retraces to this point but fails to hold above it, combined with a model top signal, a 30% short position can be established following the trend to amplify gains using momentum.
• Risk Control: Initial stop-loss for the short is set approximately 2% above the entry price (i.e., entry price × 1.02), strictly controlling maximum loss.
• Exit: When the decline reaches support levels combined with model signals, gradually close positions to realize profits.
IV. Bitcoin Short-term Operation Review (03.16~03.23)
1. Short-term Operation Review:
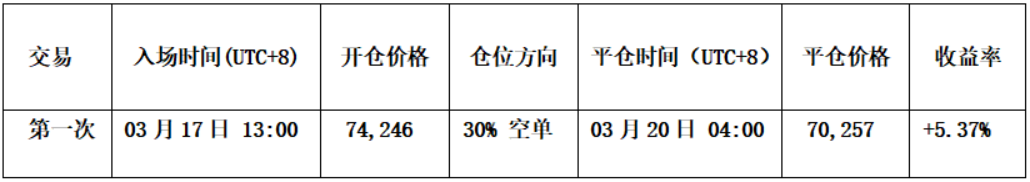
We strictly followed trading signals from our self-constructed spread trading model and momentum quantification model, combined with our market forecast, and completed one short-term (short) operation last week, achieving a trading profit of 5.37%, with complete execution discipline.
① Summary of Bitcoin Short-term Trade Details (Leverage×1):
 ② Short-term Trade Review:
• Entry: When the price rebounded near $76,000 and encountered resistance, the Spread Trading Model simultaneously triggered a strong top warning signal (green dot in the chart), forming a selling resonance with the Momentum Quantification Model. The two model signals were highly consistent, with clear top pressure characteristics. Based on this signal叠加, we established a 30% short position at $74,246, with ample entry justification.
• Exit: When the price fell and stabilized near $69,000, and the Spread Trading Model triggered a bottom warning signal, initial support characteristics emerged. Therefore, we fully exited around $70,257, timely realizing profits.
• Summary: This trade successfully profited approximately 5.37%. The short direction judgment was accurate, with both entry and exit supported by model signals, indicating good overall execution quality.
2. Medium-term Operation Review:
The medium-term strategy continues to advance steadily. We continue to hold the 60% short position established around $89,000 (January 28th). As of last week's post-market close (closing price around $67,865), the profit is approximately 23.75%, with a maximum profit during the period reaching 32.58%. The medium-term position is performing well overall.
V. Special Notes
Risk management is the foundation of stable trading profits. Please strictly adhere to the following execution discipline:
1. Upon Entry: Immediately set the initial stop-loss level.
2. When Profit Reaches 1%: Move the stop-loss to the entry cost price (breakeven point) to ensure principal safety.
3. When Profit Reaches 2%: Move the stop-loss to the 1% profit level.
4. Continuous Tracking: Thereafter, for every additional 1% profit in price, synchronously move the stop-loss up by 1%, dynamically protecting and locking in profits.
Financial markets change rapidly. All market analysis and trading strategies require dynamic adjustment. All views, analytical models, and operational strategies involved in this article originate from personal technical analysis and are solely for personal trading log purposes. They do not constitute any investment advice or operational


