
Bitcoin Oversold Rebound Verification: Rebound, Not Reversal | Guest Analysis
- Core View: The analysis suggests that Bitcoin is currently in a weekly downtrend. The oversold rebound of wave C-2 may be nearing its end. This week is expected to maintain a range-bound consolidation pattern, with attention needed on the potential downward directional breakout. Operationally, it is advised to reduce positions on rallies and control risks.
- Key Elements:
- Bitcoin technical analysis indicates a clear weekly downtrend. Momentum, sentiment, and digital models show no bottoming signals, with the market in a downtrend continuation pattern.
- Daily chart analysis suggests the recent rebound is a weak one characterized by disorganized buying momentum and cautious sentiment, with poor sustainability. The bearish technical structure remains unchanged.
- Based on the 4-hour chart, Bitcoin is forming an "ascending consolidation" range between $72,300 and $62,500. Model signals indicate the wave C-2 rebound may be concluding.
- HYPE is in a potential main uptrend (wave Ⅲ), but its hourly adjustment structure needs monitoring. Caution is advised regarding potential contagion risk if Bitcoin breaks below $65,000.
- Regarding operational strategy, medium-term short positions established at higher levels should be held. For short-term trading, two plans are provided: go short upon encountering resistance in the $72,300-$74,500 zone, or follow the trend and go short after a decisive break below $66,250.
Key Takeaways:
• HYPE Multi-Cycle Trend Structure Deep Deconstruction: Weekly tracking. (Detailed explanation in Part 1)
• BTC Strategy Execution (Short-term) Performance Verification: Bitcoin followed the established short-term strategy last week, completing one short-term short position operation (1x leverage), successfully achieving a profit of approximately 6.41%. (Details in Table 1)
• BTC Strategy Execution (Medium-term) Performance Verification: Bitcoin followed the established medium-term strategy last week, continuing to hold the short position opened at around $89,000 (1x leverage). As of last week's close (approximately $65,971), the profit is about 25.88%, with a maximum profit during the period of about 32.58%.
• Core View (Short-term) Verification: Bitcoin continued to maintain a weak range-bound consolidation pattern last week. The current price action aligns with expectations.
• BTC Price Action Forecast and Medium/Short-term Trading Strategies for This Week.
The following sections will provide a detailed review of market forecasts, strategy execution, and specific trading processes.
1. HYPE Multi-Cycle Trend Structure Analysis and Short-term Trading Review:
HYPE Daily Candlestick Chart
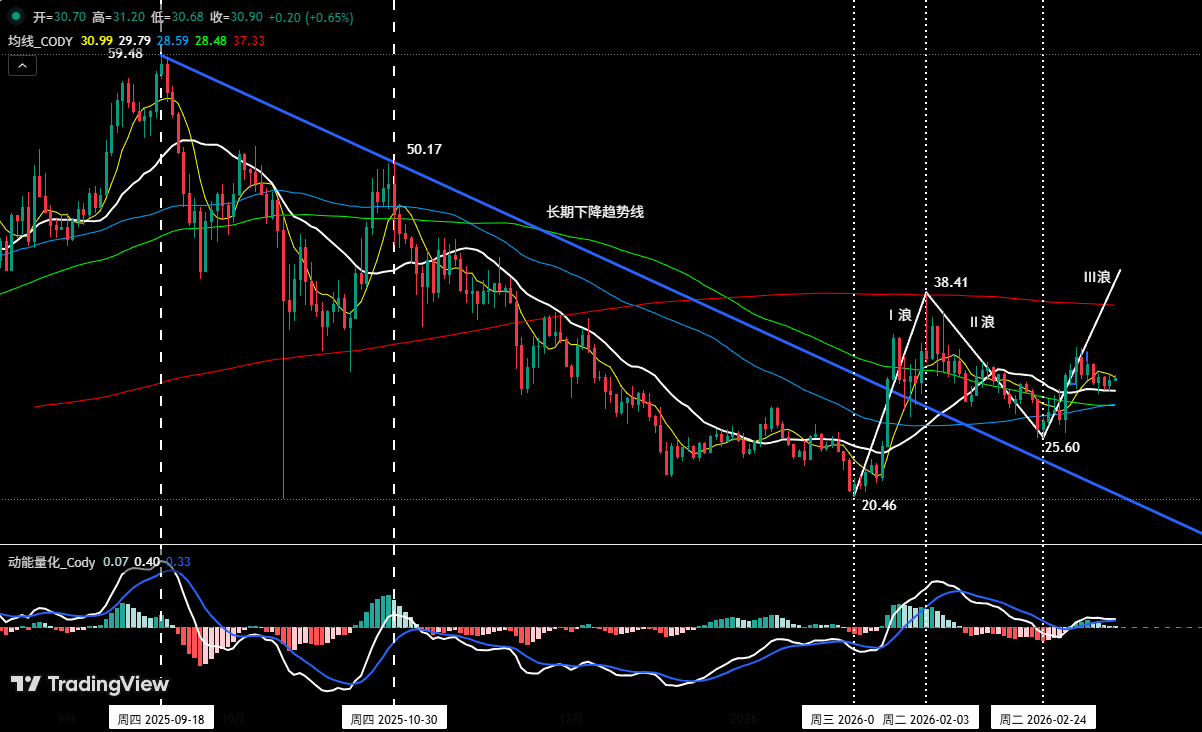
Figure 1
We first highlighted the investment opportunity in HYPE in the weekly review on February 22, clearly stating the potential for a main upward move (Wave III) in the near term. In the weekly review on March 1, we reiterated that the low of $25.60 on February 24 might be the starting point of Wave III, which is currently in progress.
1. Large-scale Trend Structure Analysis (See Figure 1): (Based on price action evolution after January 21)
• Wave I (Impulse Wave): From the low of $20.46 on January 21 to the high of $38.41 on February 3, lasting 14 days, with a maximum gain of 87.73% during the period.
• Wave II (Corrective Wave): From the high of $38.41 on February 3 to the low of $25.60 on February 24, lasting 20 days, with a maximum decline of 33.35%.
• Wave III (Potential Impulse Wave): From the low of $25.60 on February 24 to the present, currently in progress, lasting 13 days, with a maximum gain of 31.5% so far.
• From the Moving Average System Perspective: The upward move initiated on February 24 has effectively broken through multiple moving average resistances. The current price is retesting key medium-term moving averages (e.g., the 21-day MA) to test support strength post-breakout. In terms of volume, it shows a healthy pattern of "increasing volume on rallies, decreasing volume on pullbacks," indicating good price-volume relationship coordination.
• From the Momentum Quantification Model Perspective: The daily momentum line continues to operate above the zero axis, indicating the market is in a clear uptrend. The current price action is in a phase of momentum accumulation and consolidation.
2. Small-scale Structure Analysis: (Based on price action after March 2)
HYPE 1-Hour Candlestick Chart
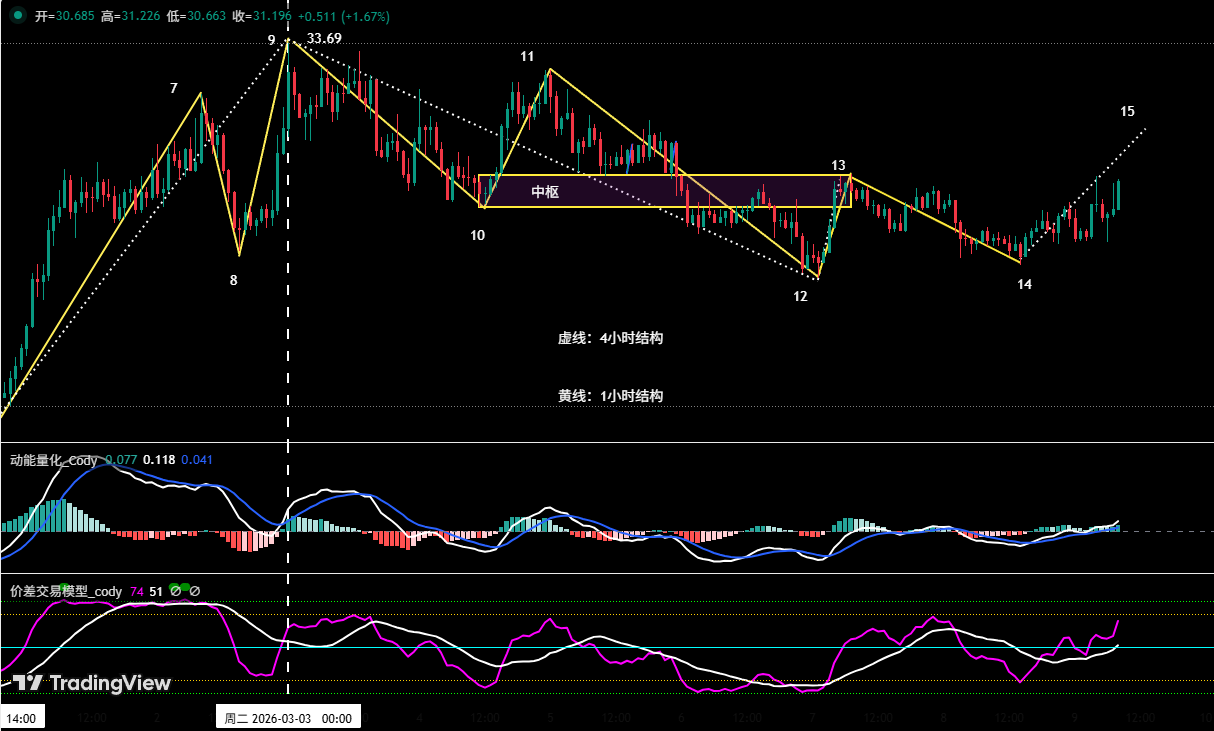
Figure 2
As shown in (Figure 2), the upward move in HYPE initiated from the low on February 24 entered a correction phase after touching the high of $33.69 on March 2. Below, we will start with the 1-hour level structure to analyze in detail the potential end signals and inflection points of this correction.
• Internal Structure Division: (From the high of $33.69 on March 2 to present)
It can be subdivided into a 5-segment structure: 9-10, 10-11, 11-12, 12-13, 13-14, forming a complete corrective pattern.
• Central Pivot (Zhongshu) Formation: Within the 5-segment structure, 9-10 is the entry segment, 13-14 is the exit segment, and the three segments 10-11, 11-12, 12-13 constitute the central pivot structure.
• Correction Inflection Point Formation and Validation: As shown in (Figure 2), a divergence signal has formed between the entry and exit segments. Therefore, we believe there is a high probability that this correction ended at pivot point 12. If the upward move starting from pivot point 12 first effectively stabilizes above the $31.5 resistance level, and then breaks through the local previous high of $32.75, the probability of this correction ending and a new upward wave beginning will significantly increase. (Special emphasis: Any subsequent correction in HYPE should not fall below the price at pivot point 12 (approximately $29.44). Otherwise, the above conclusion is invalid, and the correction inflection point will shift later.)
3. HYPE Upside Risk Warning: Although HYPE's price action shows some independence, it cannot completely detach from the broader Bitcoin environment. If Bitcoin continues to weaken and breaks below key support levels (e.g., around $65,000), it may intensify selling pressure across the altcoin market, thereby affecting HYPE's rebound momentum.
4. HYPE Short-term Trading Review (1x Leverage): (03.02~03.08)
We assessed that HYPE was in an uptrend on the daily timeframe. Last week, adhering to the core trading strategy of "following the trend" and combined with our analysis of the hourly correction structure, we did not open any new (long) positions during this period.
2. Bitcoin Last Week's Trading Strategy and Key Level Review: (03.02~03.08)
1. Short-term Trading Strategy Review: (See Table 1)
Strictly following the trading signals from our self-constructed Spread Trading Model and Momentum Quantification Model, and combined with market forecasts, we executed one short-term (short) trade last week, achieving a profit of 6.41%.
①、Bitcoin Short-term Trade Details Summary: (Leverage *1x)
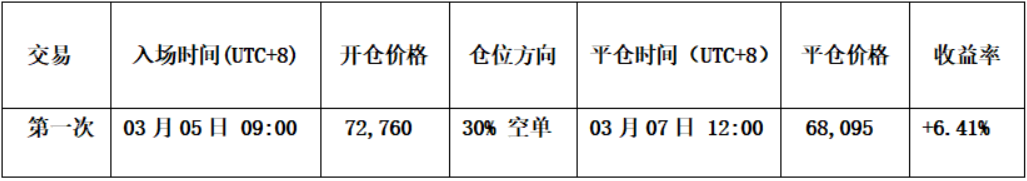
Table 1
②、Short-term Trade Review: (See Figure 3)
• Entry: The price rebounded to near the key resistance level of $74,500 and faced rejection. Simultaneously, the Spread Trading Model triggered a top warning signal (green dot in the chart), coupled with bearish resonance signals from both models. A 30% short position was established at $72,760.
• Risk Control: Initial stop-loss for the short position was set above $75,500.
• Exit: When the price fell to near $68,000, and the Spread Trading Model triggered a bottom warning signal (red dot in the chart), the entire position was closed near $68,095.
• Summary: This trade yielded a profit of 6.41%.
Bitcoin 60-Minute Candlestick Chart: (Momentum Quantification Model + Spread Trading Model)

Figure 3 (Short-term Trade Illustration)
2. Medium-term Trading Strategy Review:
Medium-term Strategy: Continued holding the 60% short position established around $89,000 (on January 28). As of last week's post-market close (closing price approximately $65,971), the profit is about 25.88%.
3. Bitcoin Technical Indicator Analysis
Combined with market movements, based on our self-constructed trading system, we conduct an in-depth analysis of various Bitcoin technical indicators from multiple models and dimensions.
1. Analysis from the Weekly Level, as shown in (Figure 4):
Bitcoin Weekly Candlestick Chart: (Momentum Quantification Model + Sentiment Quantification Model)
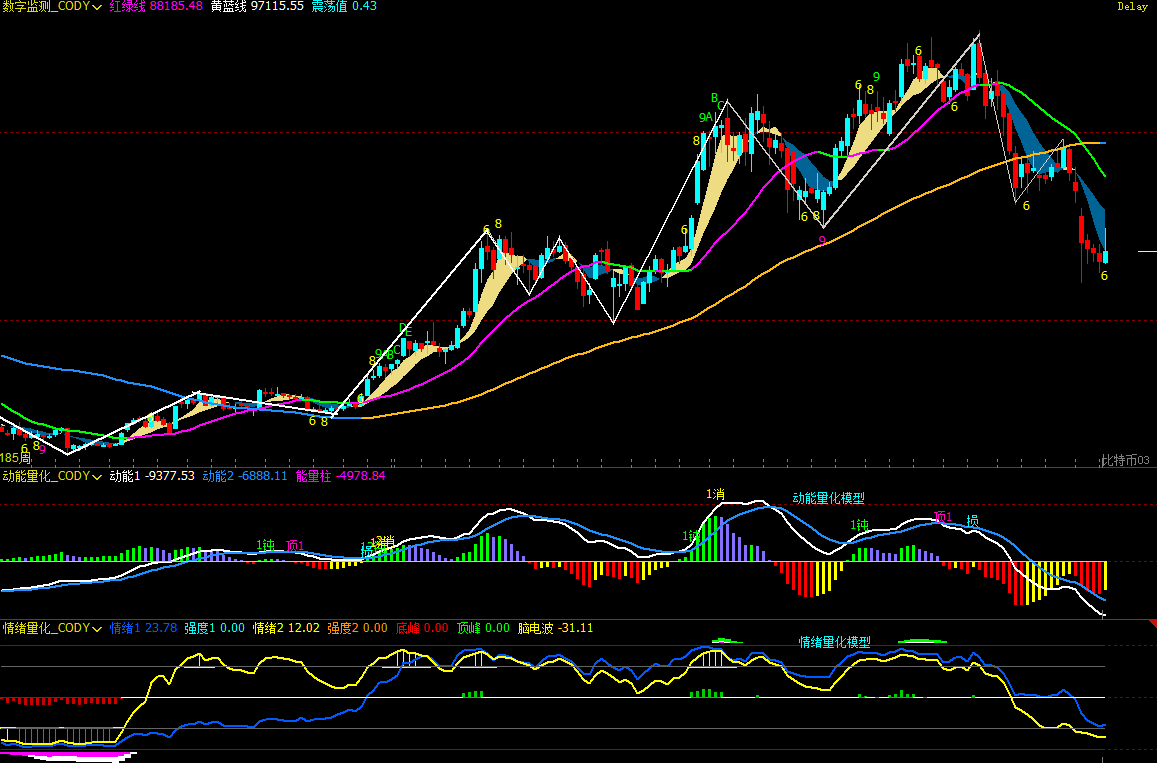
Figure 4
• Momentum Quantification Model: Technical indicators show the momentum line declining synchronously, with negative energy bars gradually shortening. No momentum divergence signal has appeared.
• Sentiment Quantification Model: Blue sentiment line value is 23, intensity zero; Yellow sentiment line value is 11, intensity zero; peak value is 0.
• Digital Monitoring Model: Moving averages are in a bearish alignment. Last week closed with a small bullish candle with a long upper shadow, up 0.3%; No bottom digital monitoring signal has appeared.
Comprehensive Analysis: Based on data from the above three models, we believe that the current Bitcoin weekly-level bearish trend is clear and ongoing. Neither momentum divergence, extreme sentiment release intensity, nor bottom signals from the digital model have appeared. It is currently in a downtrend continuation pattern. After several weeks of sideways consolidation, the market is likely to choose to test lower levels again.
2. Analysis from the Daily Level: As shown in (Figure 5)
Bitcoin Daily Candlestick Chart: (Momentum Quantification Model + Sentiment Quantification Model)
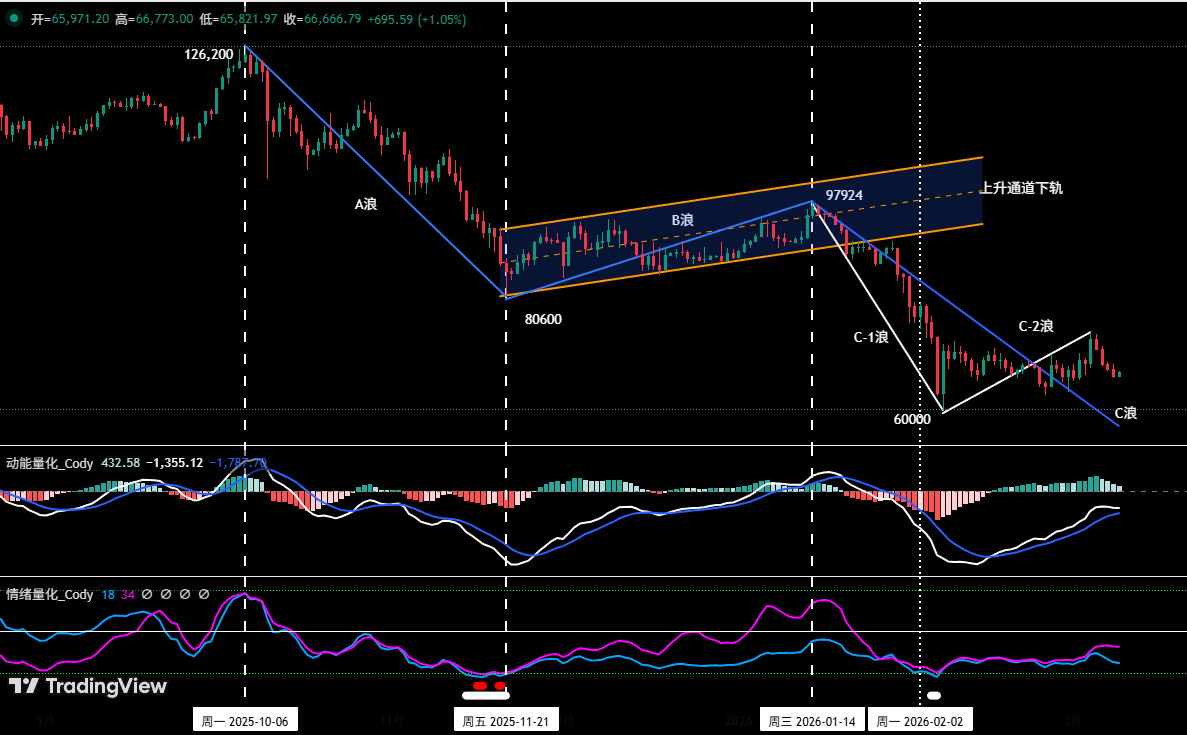
Figure 5
• Momentum Quantification Model: Last week's price action overall showed a pattern of "rising first, then falling." The momentum line moved synchronously upward below the zero axis, with positive energy bar changes appearing disorderly.
• Sentiment Quantification Model: After last week's daily close, the blue sentiment line value was 19, intensity zero; the purple sentiment line value was 35, intensity zero, slowly exiting the oversold area.
Comprehensive Analysis: After analyzing data from the Momentum Quantification and Sentiment Quantification models, we believe the technical structure of Bitcoin's daily bearish trend has not changed. The current price action is an oversold rebound, and due to disorderly buying momentum, cautious market sentiment, and low capital participation, this rebound is weak with poor sustainability.
4. This Week's Market Forecast: (03.09~03.15)
1. Bitcoin Uptrend Central Pivot Formation (Based on price action after the February 6 low): (Updated weekly)
Bitcoin 4-Hour Candlestick Chart
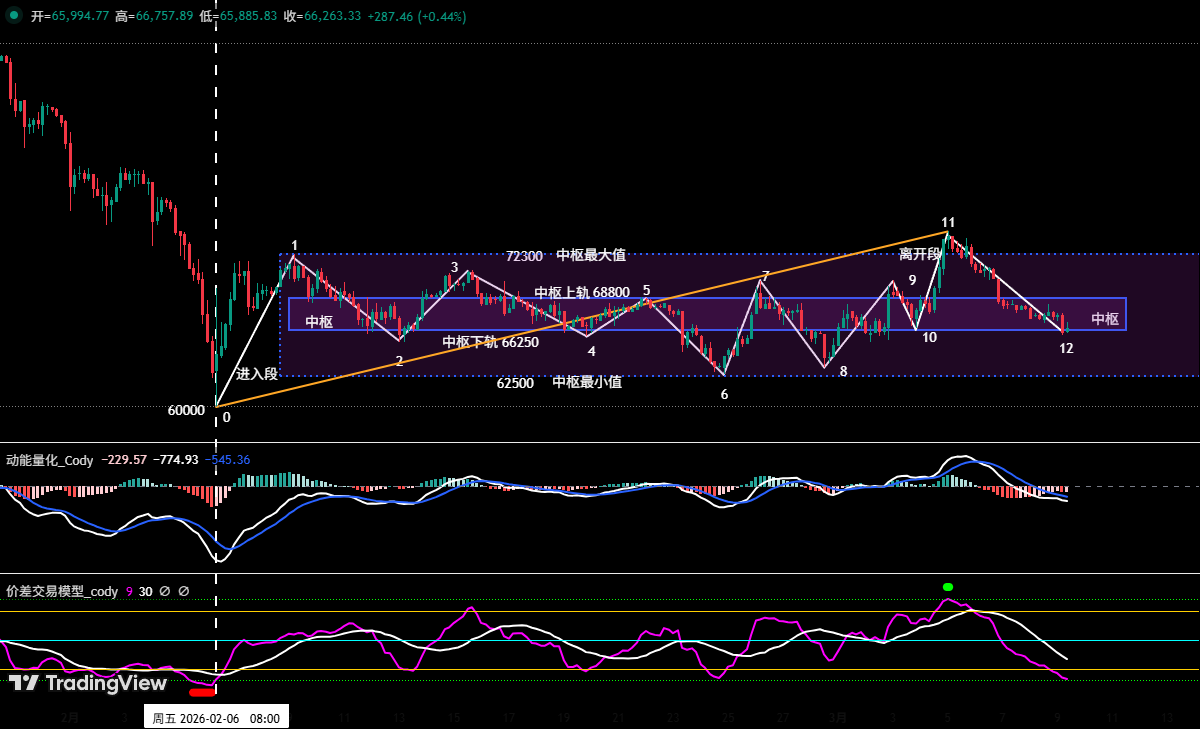
Figure 6
Using Bitcoin's 4-hour chart as the analysis period:
• Central Pivot Formation: As seen in (Figure 6), the "uptrend central pivot" structure is basically formed. Its highest resistance is around $72,300, and its lowest support is around $62,500; the pivot upper boundary is around $68,800, and the pivot lower boundary is around $66,250.
2. C-2 Wave Rebound End Judgment:
• We maintain the previous core analytical framework: The upward move in Bitcoin initiated from the February 6 low (approximately $60,000) is, in nature, an oversold rebound within the large-scale Wave C correction—specifically the C-2 wave. This is expected to be followed by a C-3 wave corrective move.
• Bottom Warning: As seen in (Figure 6), our self-built Spread Trading Model triggered a bottom warning signal (red dot) near pivot point 0 on February 6, precisely capturing the start of the C-2 wave.
• Top Warning: At the recently formed pivot point 11, the Spread Quantification Model switched to triggering a top warning signal (green dot). The successive appearance of bottom and top warning signals confirms, from a model perspective, the formation of a complete rebound wave, suggesting upward momentum may be exhausted.
3. This Week's Core View: Maintain the range-bound consolidation pattern. The C-2 wave oversold rebound may be nearing its end. Monitor for directional breakout. Strategically, firmly implement the operational principle of "reducing positions (longs) on rallies, controlling risk."
4. Core Resistance Levels:
• First Resistance Zone: $72,300 - $74,500 area (Previous high-volume transaction concentration area)
• Second Resistance Zone: $79,500 - $80,600 area (Near the November 2025 low)
5. Core Support Levels:
• First Support Level: Around $65,000 (Previous important support area)
• Second Support Level: $60,000~$62,500 area (Near the February 6 low)
• Third Support Level: Around $57,400
5. This Week's Trading Strategy (Excluding Impact of Sudden News): (03.09~03.15)
1. Medium-term Strategy: See Figure 7
Bitcoin Daily Candlestick Chart: (Position Monitoring Model)

Figure 7
Position Monitoring Model: Currently, the price is below the Bull-Bear Ribbon (yellow). Therefore, continue holding the 60% short position established at $89,000 (on January 28).
• If the price effectively breaks above $74,500 on a rebound, the medium-term position can be reduced to 40%.
• If the price effectively breaks above and stabilizes above the Bull-Bear Ribbon, clear all medium-term positions.
2. Short-term Strategy: Utilize 30% of capital, set stop-loss points, and look for "spread" trading opportunities based on support and resistance levels. (Use 30-minute/60-minute as the operational timeframe).
3. As the medium-term market direction is bearish, to dynamically respond to complex market evolution and signals from our self-built trading models, we have formulated two short-term operational plans, A/B:
• Plan A: Short on rallies encountering resistance.
• Entry: When the price


