
比特币が7.9万ドルの壁に直面、6.5~7万ドルが重要なサポートに
- コア見解:ビットコイン価格は、真の市場平均(約7.8~7.9万ドル)と短期保有者コストベースで強い抵抗に直面し、中期的な下落バイアスが強まっている。現物売り圧力が緩和し、機関投資家の資金フローが安定化しているものの、弱い需要と過去最高のショート建玉が市場をレンジ相場に留めており、6.8~7万ドル圏が重要なサポートとなっている。
- 主要な要素:
- 価格は真の市場平均(約7.9万ドル)と短期保有者コストベースで抵抗に遭い、短期保有者の利食い売りが1時間当たり40億ドルに急増し、強力な売り圧力を形成している。
- 現物出来高デルタは大幅なマイナスから中立付近まで回復し、売り圧力が緩和され買い手が再び参入し始めていることを示すものの、需要は持続的なブレイクアウトには至っていない。
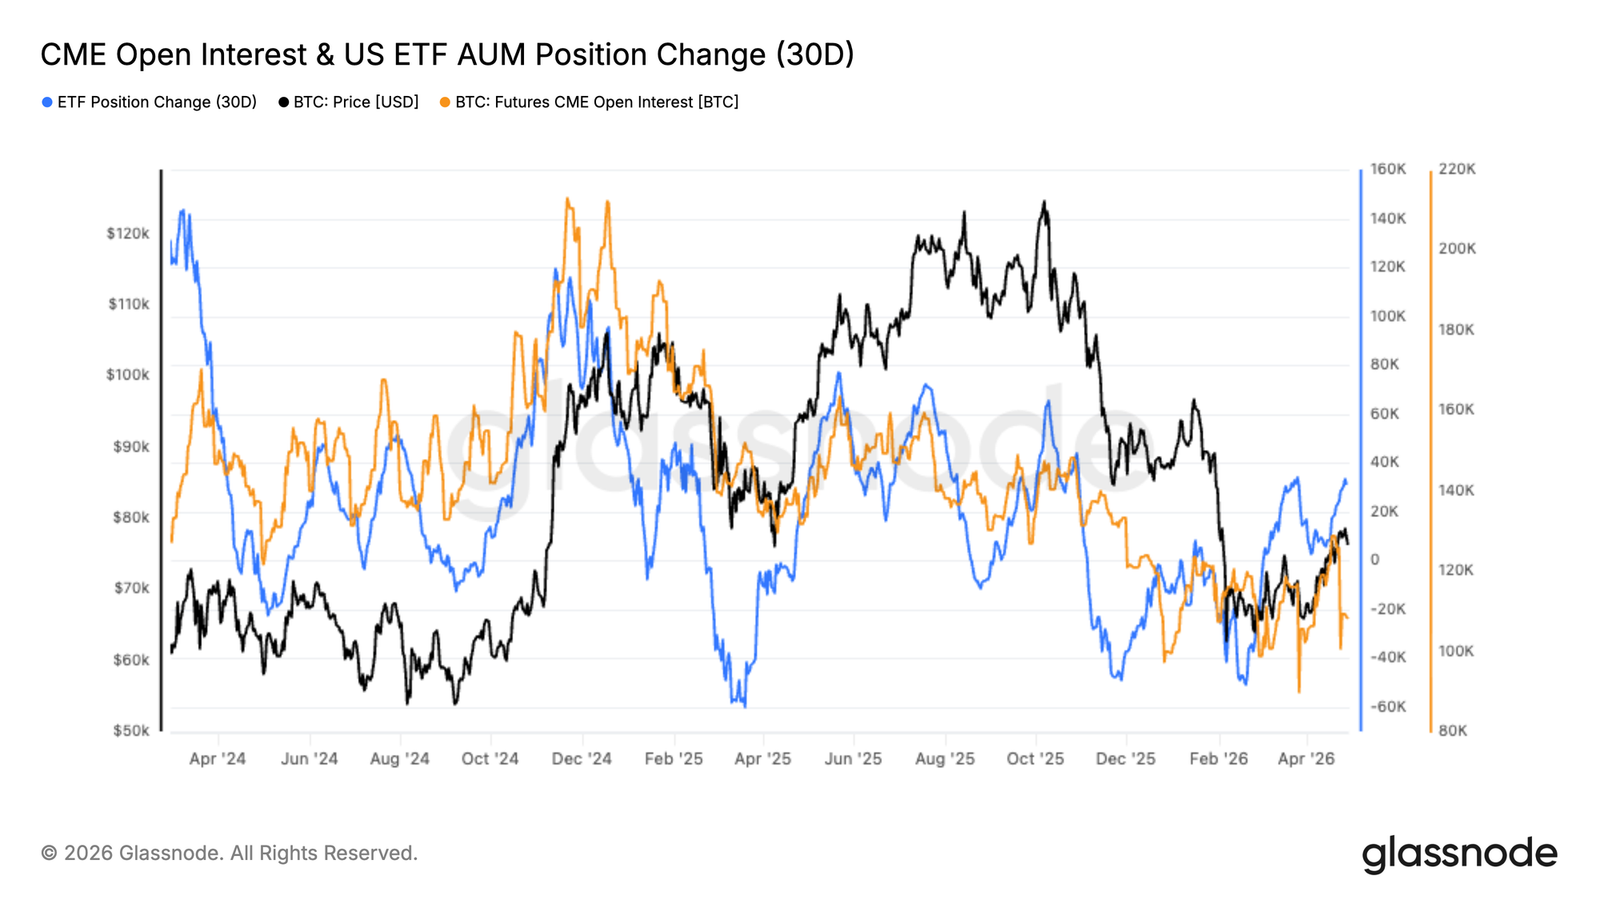
- 機関投資家のポジションに初期の回復兆候:米国現物ETFの運用資産残高がリバウンドし、CME建玉も継続的な流出後に底を打ち始めている。
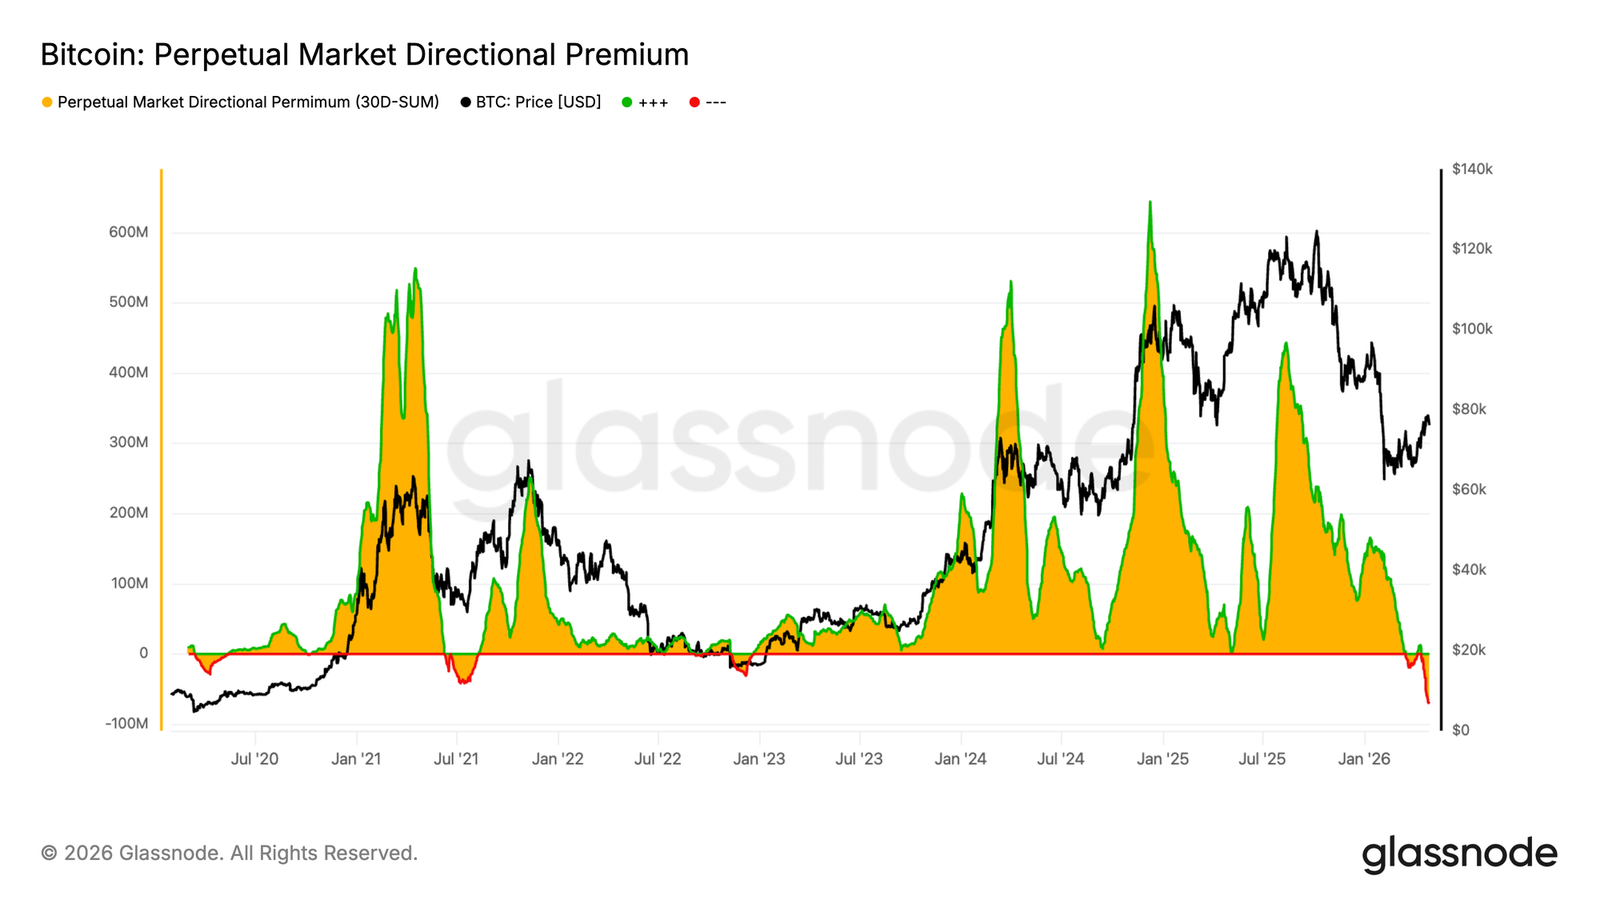
- 永久先物市場のネットショートポジションは過去最高となり、極端なディスカウントはヘッジと防御的な姿勢の高さを反映しており、ショートスクイーズの可能性を示唆している。
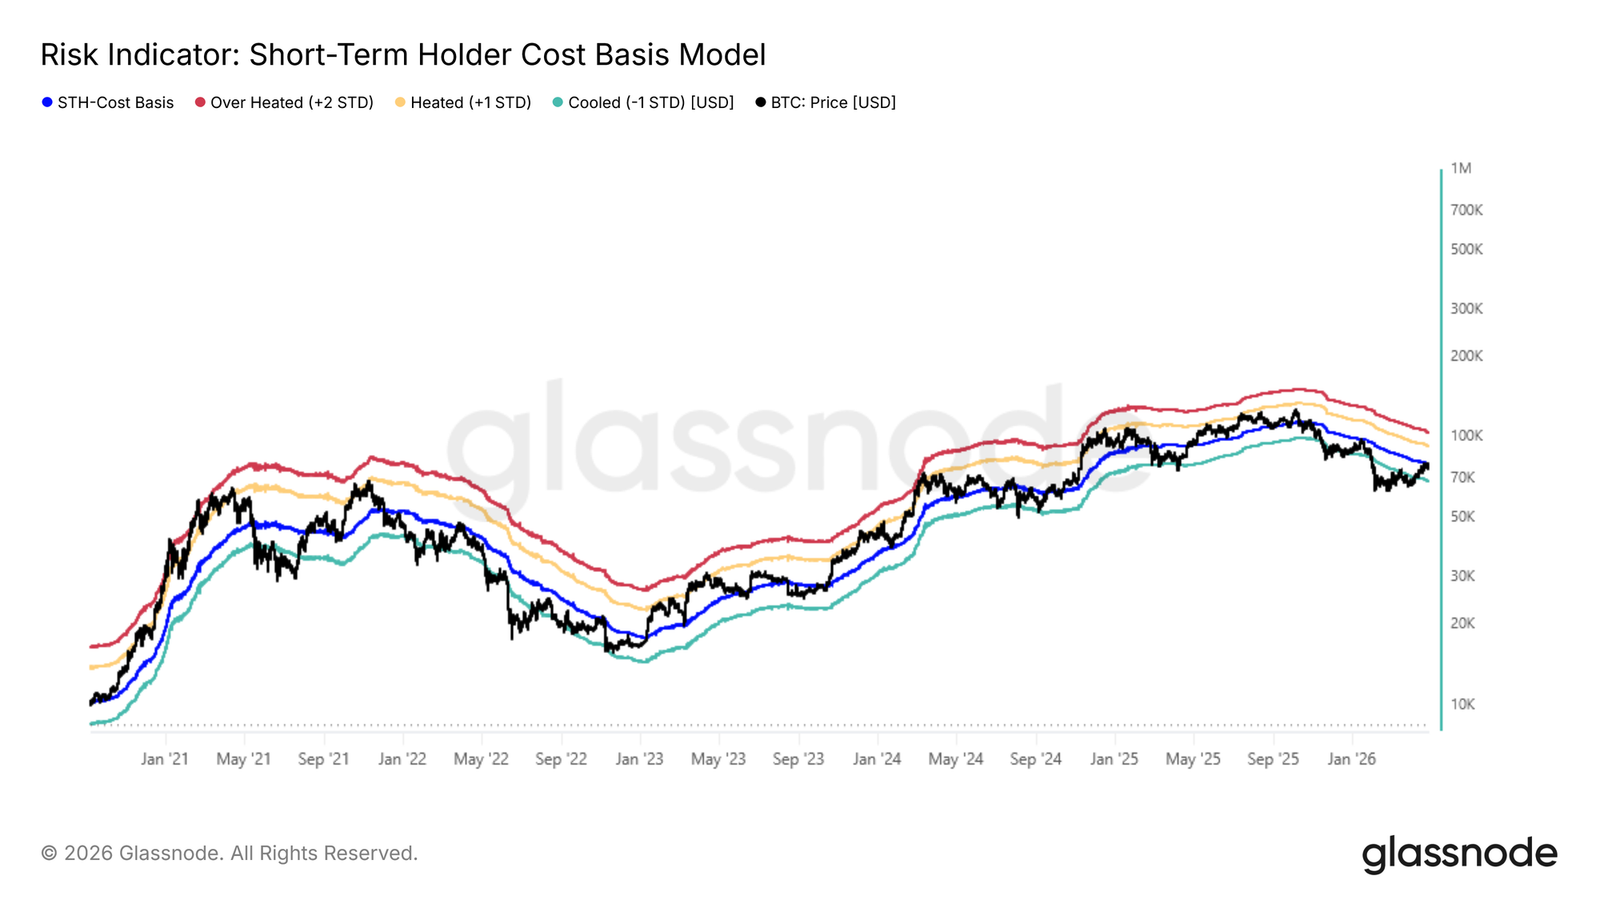
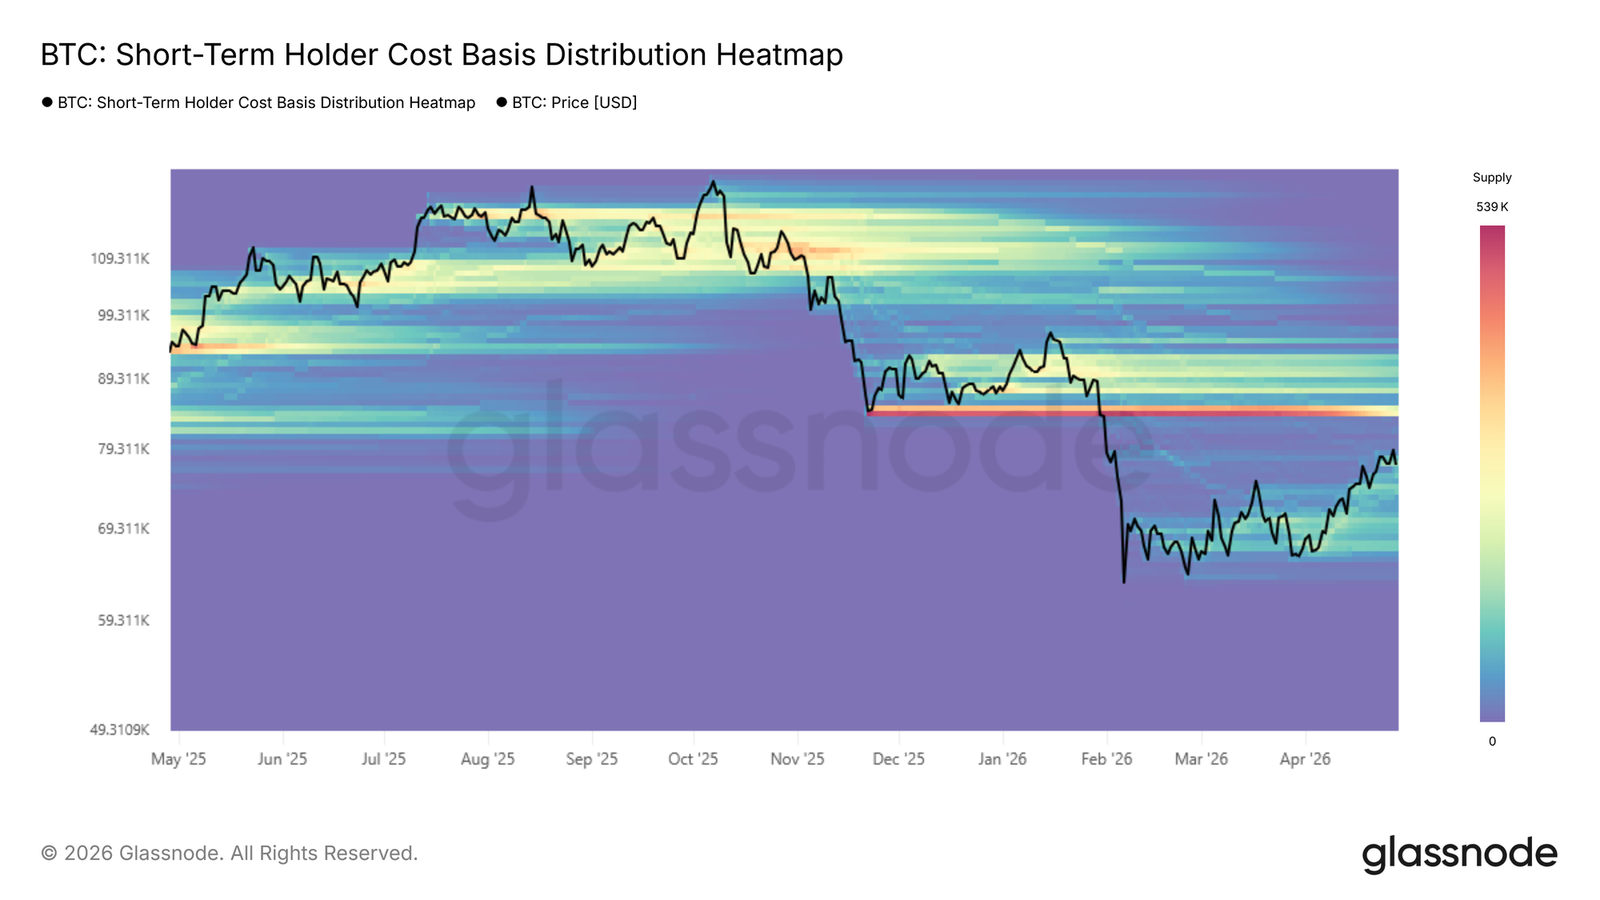
- 6.5万~7万ドル圏で形成された濃密な累積クラスターが短期的なサポートとなるが、これを下抜けると市場構造が弱体化する可能性があり、短期保有者コストベースの-1標準偏差(6.8万ドル)に注目。
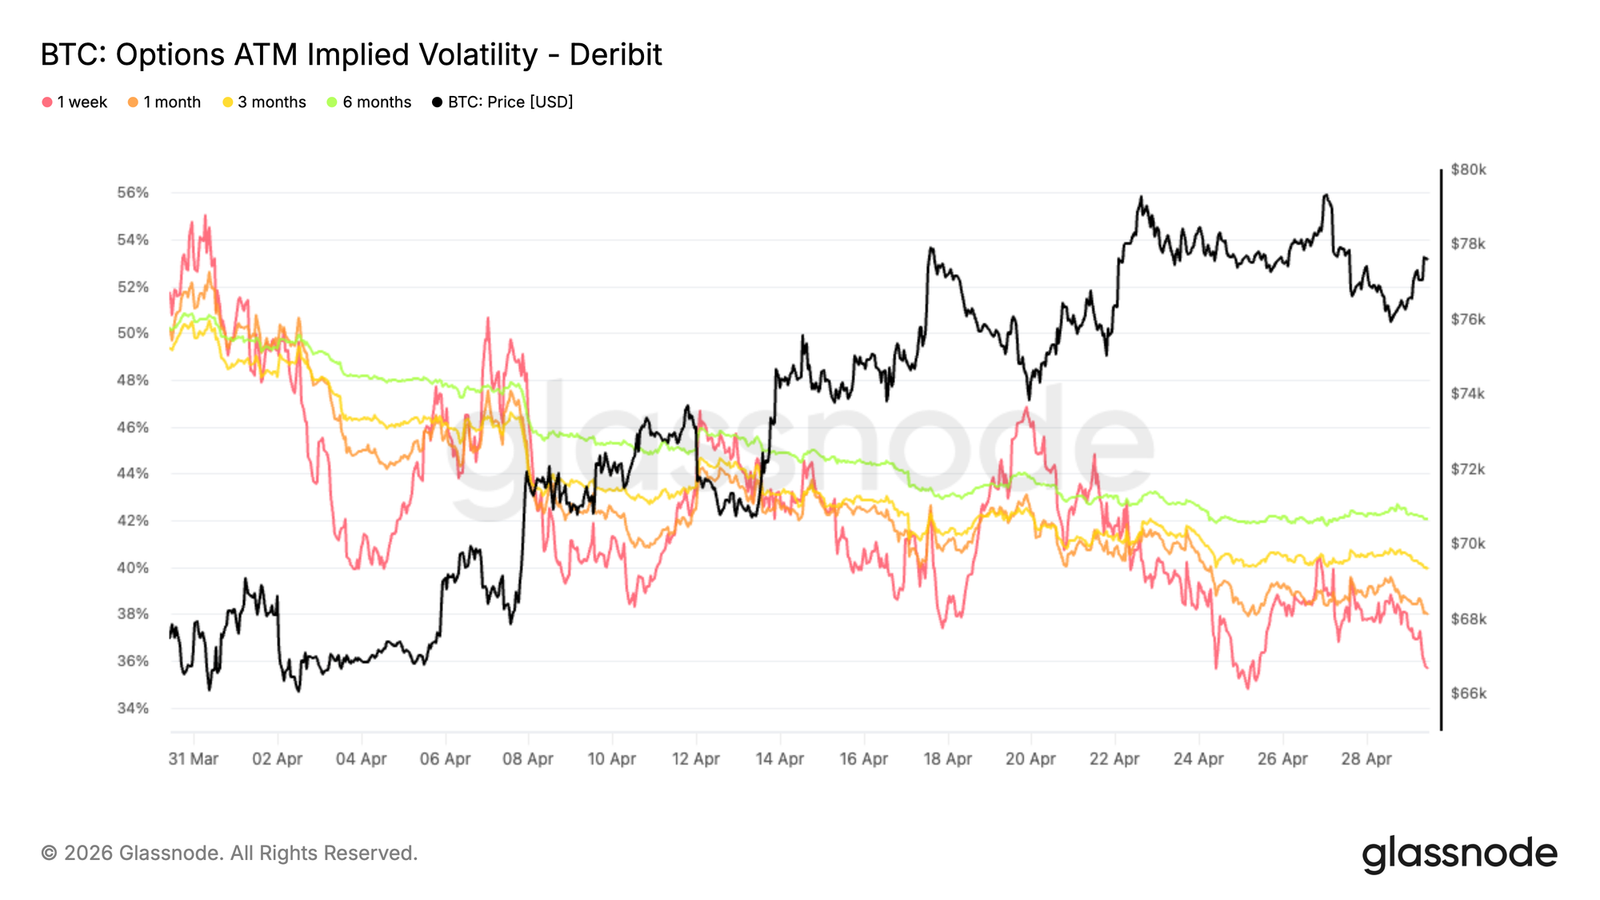
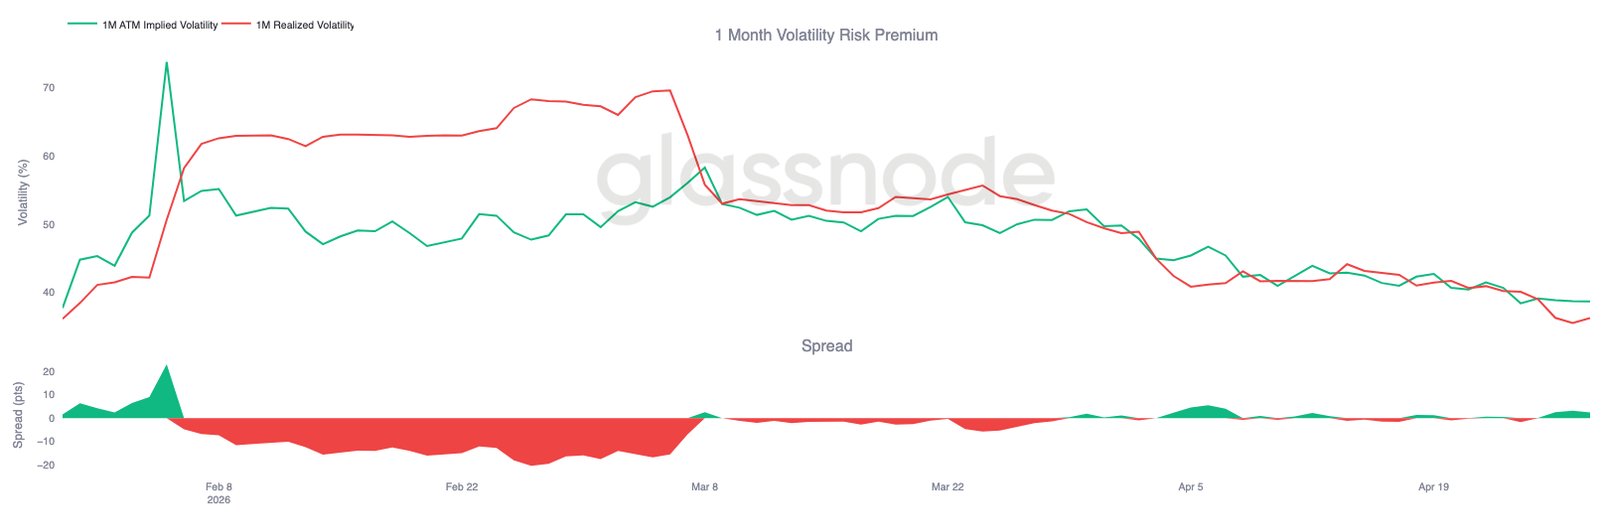
- インプライド・ボラティリティは全期間にわたり低下を続け、1ヶ月実現ボラティリティは36まで低下し、インプライド・ボラティリティ(38)に接近。市場の価格付けは安定化しているが、方向性に対する確信は限定的。
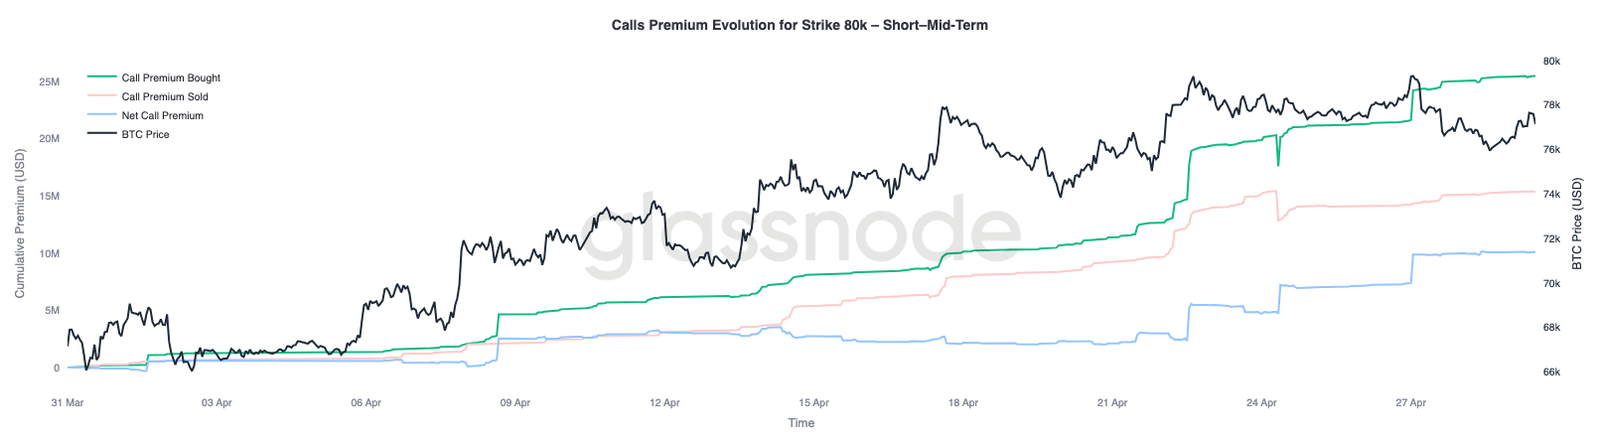
- 8万ドル行使価格への継続的な買い意欲が見られ、さらに上下の7.6万ドルと8.2万ドルにはマイナスガンマ領域が存在するため、8万ドルを突破すれば急激な上昇反応を引き起こす可能性がある。
Original Author: Glassnode
Original Translation: AididiaoJP, Foresight News
Bitcoin remains suppressed below the Real Market Price, with support located in the $65,000 to $70,000 range. Spot selling pressure is easing, capital flows are stabilizing, but demand remains weak. Heavy short positioning leaves room for a squeeze in this range-bound market.
Summary
- The price breakout faced resistance at the Real Market Price (~$79,000) and the Short-Term Holder Cost Basis, reinforcing a mid-term bearish bias.
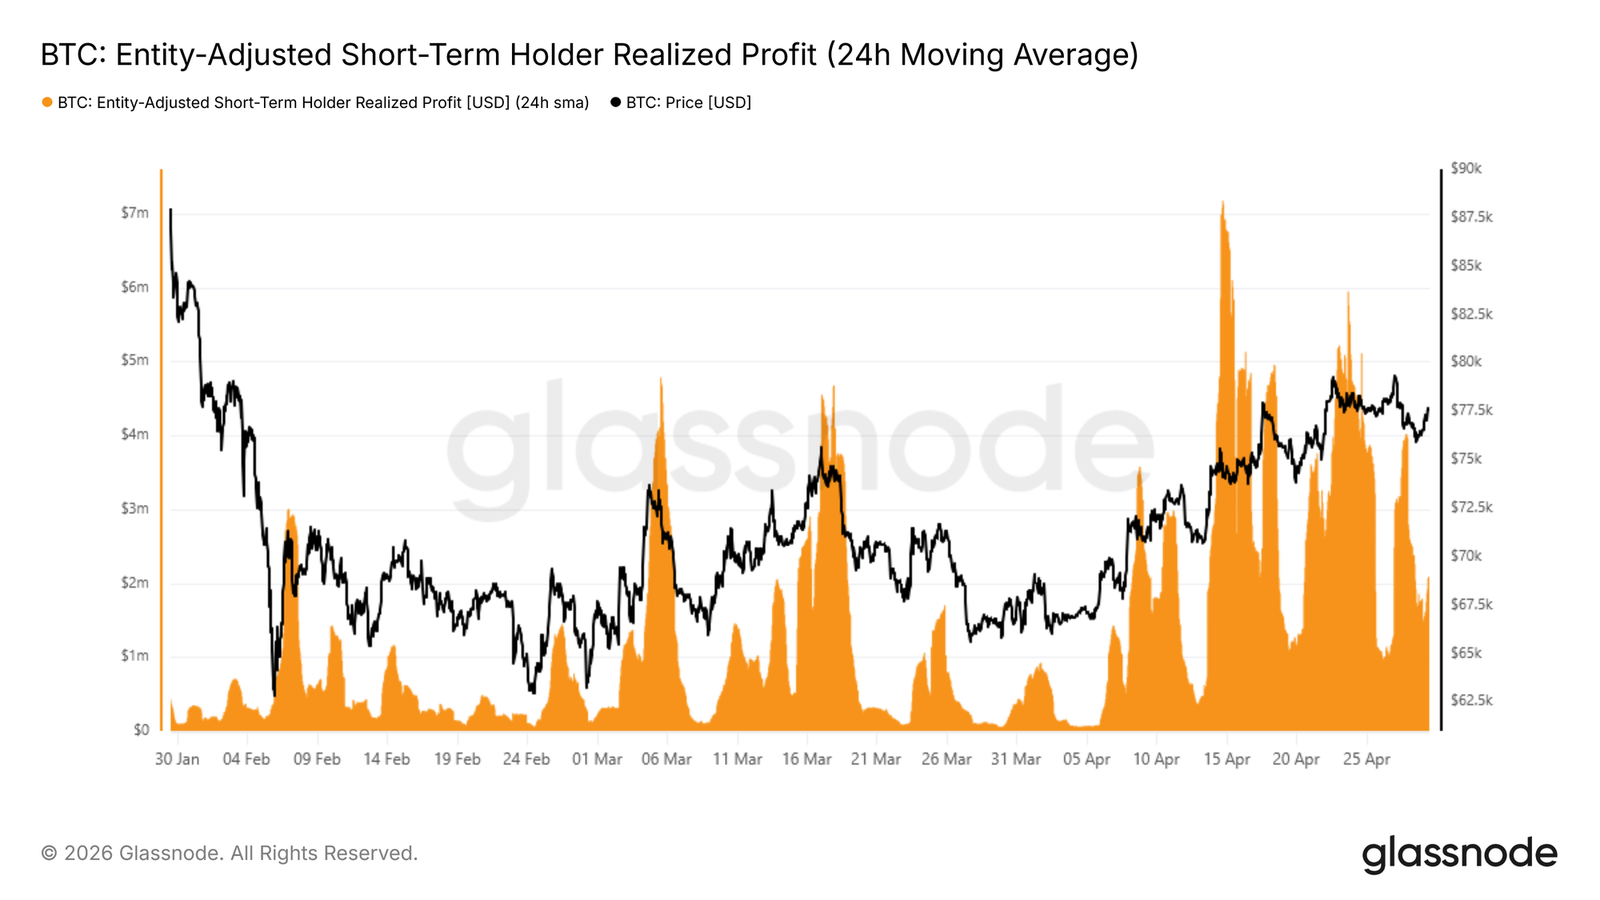
- Short-Term Holder realized profits surged to an hourly rate of $4 billion, reflecting significant profit-taking selling pressure that capped the rebound's sustainability.
- The dense accumulation cluster between $65,000 and $70,000 provides short-term support, but a breakdown below this level would weaken the short-term structure.
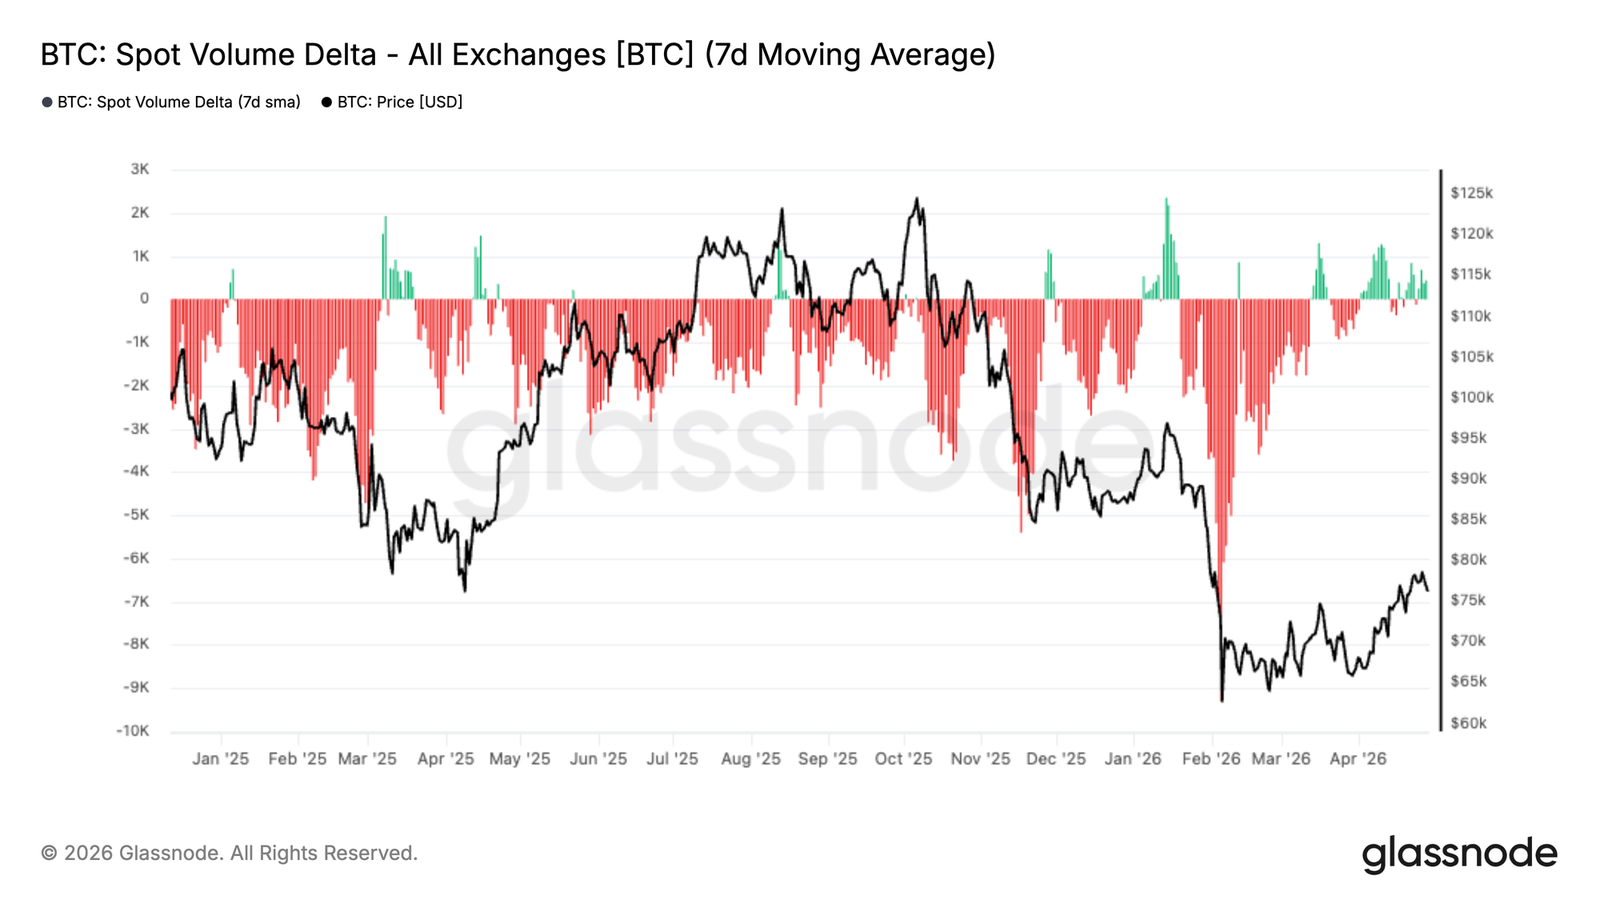
- Spot selling pressure is easing, with the volume delta recovering to near neutral and early signs of buyer re-engagement.
- Institutional capital flows are stabilizing; ETF AUM is rebounding, and CME open interest is beginning to bottom out after sustained outflows.
- Perpetual swap positioning has shifted to a record net short bias, highlighting increased hedging activity and the potential for a short squeeze.
- Volatility continues to compress; demand for protection is rising but conviction is weak, reinforcing a cautious, range-bound pattern.
- Realized volatility and implied volatility are highly aligned, confirming a calmer market backdrop with limited directional conviction.
On-Chain Insights
Breakdown Meets Resistance, Focus Shifts to Support Lines
Last week, this report identified the Short-Term Holder Cost Basis and the Real Market Price as the most likely resistance zones for the current bear market rally, with profit-taking by recent buyers reaching levels historically consistent with local tops. The price was subsequently rejected precisely in this region, failing to sustain a position above the Real Market Price of $78,000 and the Short-Term Holder Cost Basis of $79,000. This is a textbook pattern in bear markets: price approaches the breakeven point of the most price-sensitive cohort, exit incentives overwhelm growth demand, thereby exhausting upward momentum.
With this rejection confirming overhead resistance, the mid-term bias shifts towards further downward pressure. Attention now turns to the -1 standard deviation zone around $68,000 as the most immediate structural support level to monitor closely.
The Breakdown in Detail
The rejection at the Short-Term Holder Cost Basis is not just a price observation; on-chain spending data precisely captures how it unfolded. The 24-hour simple moving average of Short-Term Holder realized profit volume is a real-time gauge of how aggressively recent buyers are converting unrealized gains into exits.
As the price approached $80,000, this metric surged to approximately $4 million per hour, roughly four times the baseline level established since mid-April. This confirms that short-term holders used the rally as a distribution opportunity. Buyer-side liquidity was entirely insufficient to absorb this wave of profit-taking, capping momentum and triggering the subsequent rejection.
This metric is most useful when analyzing two dimensions simultaneously: the baseline (as a proxy for the broader trajectory of buyer liquidity) and the peaks (which have consistently served as reliable local top indicators in the current bear cycle).
Two Scenarios, One Cluster
Resistance at the Real Market Price and Short-Term Holder Cost Basis zones reinforces the broader structural weakness characteristic of this bear market. However, the picture is not entirely bearish.
The dense accumulation cluster built between $65,000 and $70,000 over the past two months reflects significant buyer conviction at these levels, providing a foundation for a short-term bounce towards the lower edge of the supply cluster above, near $84,000.
Conversely, if the market fails to absorb sustained selling pressure from the Real Market Price zone, this same $65,000–$70,000 accumulation cluster—and more specifically, the -1 standard deviation level of the Short-Term Holder Cost Basis around $68,000—will become the primary support reference for the short to medium term. Therefore, the path forward depends on whether buyers within this range can maintain enough conviction to overcome overhead distribution pressure.
Off-Chain Insights
Selling Pressure Eases, Buyers Re-emerge
Spot volume delta has been in deeply negative territory for most of the past few months, reflecting sustained net selling pressure on exchanges. This persistent seller dominance aligns with the broader correction, particularly during significant drawdowns towards the $60,000–$70,000 range.
However, recent data shows a clear shift. The 7-day moving average has now recovered to near neutral and is beginning to show intermittent positive delta bursts. This indicates that selling pressure is easing while buyers are starting to step back in at current levels.
From a market structure perspective, this shift is significant. While it doesn't yet indicate strong accumulation, the move towards balance suggests improving spot demand and reduced seller urgency. A sustained expansion into positive territory is needed to confirm that buyers are regaining control of the order book.
Rebuilding Institutional Liquidity
Institutional positioning is beginning to stabilize. Both CME open interest and US spot ETF AUM show early signs of recovery following a period of outflows. ETF position changes have bounced back from deeply negative levels, while CME open interest appears to be bottoming out, suggesting early re-engagement.
The earlier decline reflected broad risk aversion, with capital exiting both futures and ETF channels during the correction. The recent uptick points towards cautious re-accumulation rather than aggressive positioning.
Sustained inflows will be necessary to support a stronger trend. For now, the data indicates early institutional re-entry, but full conviction is not yet evident.
Record Short Bias
The directional premium in the perpetual swap market has dropped to its most negative level on record, marking the deepest sustained short bias in this dataset. Unlike the short-lived negative bogeys seen in previous cycles, this move reflects a more persistent defensive stance.
This extreme discount is driven by several factors. The recent price weakness has triggered increased hedging and outright shorting in the perpetual market, while the unwinding of previously crowded longs accelerated the move through liquidations. Simultaneously, lackluster spot demand and soft ETF flows have reduced natural buying pressure, allowing derivatives to dominate short-term price action.
Historically, such extremes occur during periods of high uncertainty and often precede turning points. While short-term uncertainty remains, the market is increasingly positioned for a squeeze if sentiment or spot demand improves.
Implied Volatility Declines Across the Curve
Looking back at April, starting with implied volatility, the dominant theme was broad compression across all tenors.
The 1-week at-the-money (ATM) volatility dropped by approximately 16 percentage points, and the 6-month tenor fell by about 8 points. Other tenors fell within this range, averaging a decline of roughly 10 volatility points.
The curve remains in contango, meaning longer-dated options still trade at a premium to shorter-dated ones, but at significantly lower levels. This reflects the market pricing in a more stable environment going forward.
Lower implied volatility reduces the cost of options, particularly upside calls. At the same time, demand for protection seems to have eased. Traders are no longer willing to pay high premiums for volatility exposure, which aligns with the recent price recovery and points towards normalization of expectations rather than conviction building.
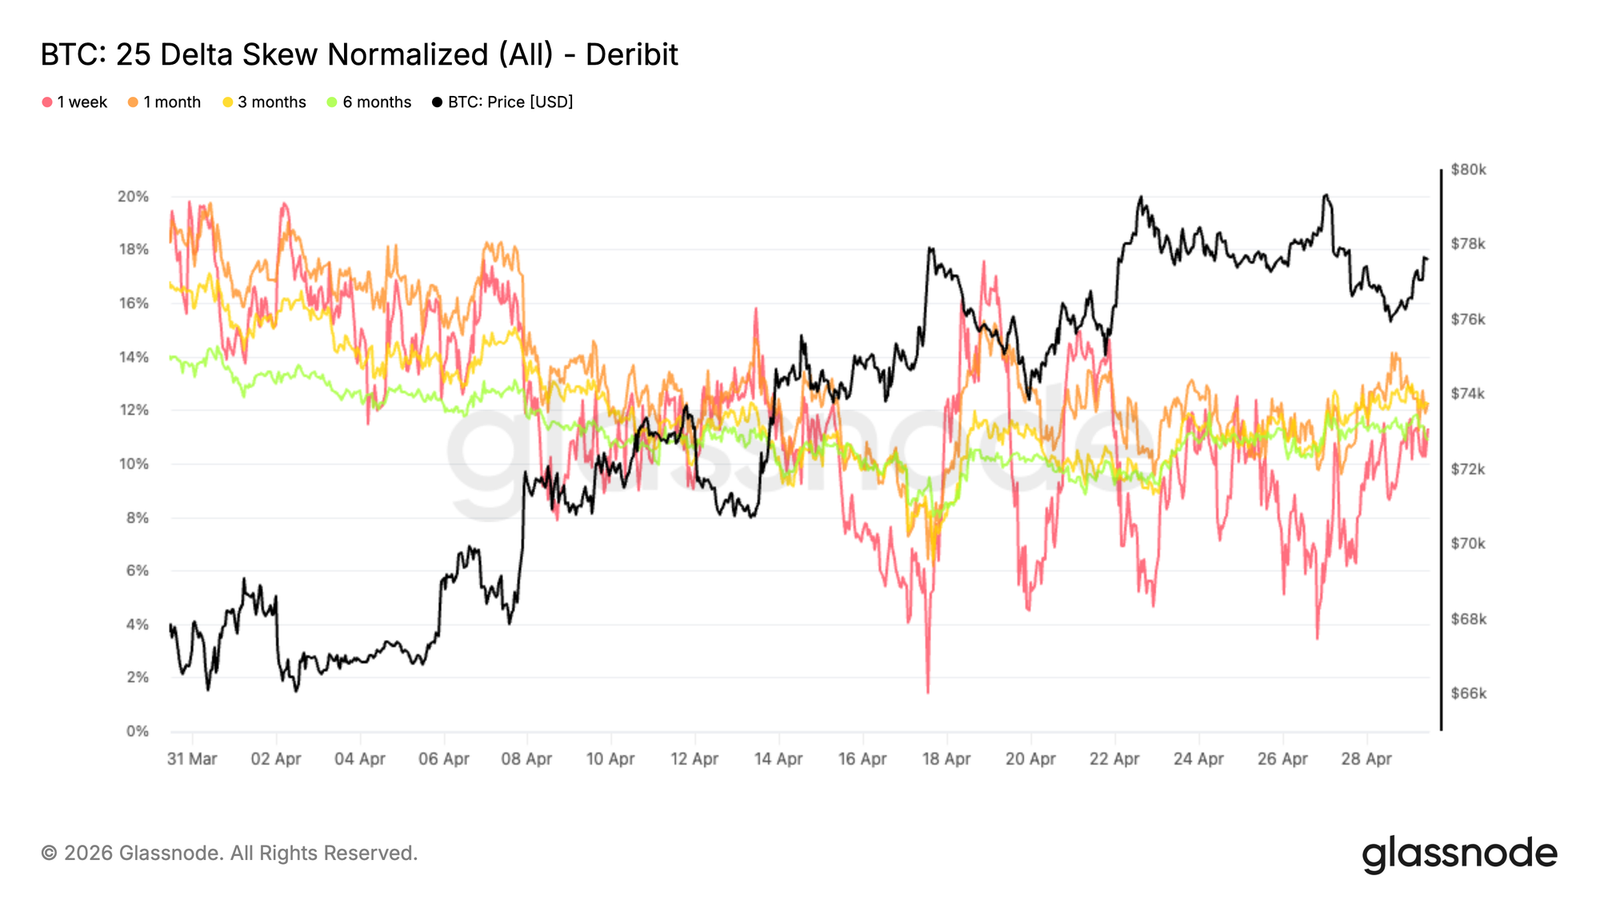
25-Delta Skew Trending Down, but Protection Persists
As implied volatility compressed, the skew revealed how protection demand evolved in April. The broader trend is a steady decline in put option premiums, with the 1-month skew falling from around 18% to 12%. This reflects a notable decrease in demand for downside protection as conditions stabilized.
On the short end, the 1-week skew reacted more sharply, experiencing several spikes towards neutral (2%–4%) at multiple points in April. These moves were primarily tactical, as pullbacks were used to buy calls and sell puts, temporarily flattening the skew.
Recently, as prices neared the $80,000 resistance, put demand picked up again, pushing skews across tenors back towards the 11%–12% range. Protection is still present; the market makes tactical adjustments on the short end while maintaining a cautious stance further out on the curve.
Realized Volatility Confirms the Downward Shift
As implied volatility continues to compress, realized volatility has moved in the same direction and reinforced the trend. Bitcoin's realized volatility has been steadily declining. This is significant because realized volatility anchors how options should be priced. When realized volatility falls, it naturally drags down implied volatility, as the need to price in large price swings diminishes.
This creates a feedback loop: cheaper options reduce the urgency to hedge, leading to fewer hedging-driven price moves.
One-month realized volatility is currently around 36, while implied volatility is near 38, leaving only a small premium for volatility sellers to assume risk.
The current environment reflects a shift from stress towards a more balanced state. Volatility is no longer being aggressively bought, and the market appears comfortable with a narrower expected price range.
Premium Accumulation at the $80,000 Strike Becomes a Key Pivot
With both volatility and skew easing, positioning becomes the next layer to monitor, and the $80,000 level is emerging as the next key focal point.
There is persistent buying of the $80,000 strike across short and medium-term tenors, indicating a growing interest in exposure above that level. This suggests traders are positioning for a test of resistance rather than shorting it.
Meanwhile, two key negative gamma zones stand out: on the downside at $76,000 and on the upside at $82,000. These levels could become areas where hedging flows amplify price action, especially in a low-liquidity environment.
A breakout above $80,000 would bring spot prices closer to the $82,000 zone, where negative gamma could force market makers to buy strength, reinforcing the move. Positioning remains cautious, but if resistance is cleared, the market is increasingly prone to a more violent upside reaction.
Conclusion
In summary, the market remains trapped below key resistance, with the Real Market Price continuing to cap upward attempts, while the support cluster near $65,000–$70,000 provides a floor. Spot selling pressure is beginning to ease, and early signs of institutional re-engagement are emerging, but demand has not yet shown the strength required for a sustained breakout.
At the same time, derivatives positioning has decisively turned bearish, with record net short exposure and elevated demand for protection reflecting a defensive mindset. This leaves the market in a finely balanced state. While the positioning weight leans towards caution, it also leaves room for a violent upside dislocation if capital flows shift.
Until a clear expansion in spot demand or institutional inflows materializes, the most likely outcome remains a choppy, range-bound environment. The next directional move is likely to be driven not just by positioning, but by whether real capital steps in to absorb supply and reclaim higher levels.


