Gate Research: Gate TradFi Connects Global Markets — Return Logic and Allocation Paths for US, Japanese, Korean, and Hong Kong Equities


- Key Takeaways: The four markets—US, Korea, Japan, and Hong Kong—derive returns from different sources; cross-market diversification only expands return sources and cannot enhance returns or eliminate drawdowns, while trend rotation can improve the risk path but struggles to consistently outperform US equities.
- Key Elements:
- Since 2016, SPY has delivered annualized returns of 14.95% with a Sharpe ratio of 0.88; EWY has annualized returns of 14.87% but volatility of 29.42%, a maximum drawdown of nearly 49.73%, and a Sharpe ratio of only 0.62.
- EWJ has annualized returns of 8.77% and a maximum drawdown of 33.14%; EWH has annualized returns of only 4.66% with a Sharpe ratio of 0.33, as low valuations have not translated into stable risk-adjusted returns.
- The trend rotation strategy achieves full-sample annualized returns of 12.1%, reduces maximum drawdown to 24.27%, and posts a Calmar ratio of 0.50, but average annual turnover of approximately 491% results in notable cost erosion.
- The inverse volatility strategy reduces annualized volatility to 16.68% while returns fall in tandem to 11.08%, tending to overweight low-volatility, low-return markets.
- Correlations among the four markets rise in tandem during crises; SPY and EWY share AI factor exposure, and country diversification may mask industry concentration.
- A benchmark portfolio of 40% US equities, 20% Japanese equities, 20% Korean equities, and 20% Hong Kong equities is recommended, with quarterly rebalancing and a 50% cap on any single market's weight.
Summary
• The US, Korean, Japanese, and Hong Kong markets each correspond to different sources of returns. US equities rely mainly on earnings growth and technology investment, Japanese equities on capital efficiency and interest rate normalization, Korean equities on the semiconductor cycle, and Hong Kong equities on Chinese corporate earnings, capital flows, and risk premiums.
• Valuation differences must be assessed alongside earnings quality and cost of capital. High US valuations require companies to consistently deliver growth, Japanese governance reform needs to translate into operating efficiency, Korean static valuations are easily distorted by cyclical profits, and Hong Kong's low valuations also require earnings, cash distribution, and capital inflows to be supported jointly.
• Cross-market diversification can expand sources of returns, but it cannot increase returns or eliminate drawdowns. Since 2016, US equities have delivered higher risk-adjusted returns; Korean equities offer stronger cyclical elasticity, Japanese equities have some diversification value, and Hong Kong equities have endured a longer valuation recovery cycle.
• Gate TradFi integrates equities and related indices from the US, Korea, Japan, and Hong Kong, along with FX and precious metals quotes, into a unified observation and trading environment, helping to connect macro judgment, price verification, instrument selection, and risk management.
1. Global Pricing Environment: Four Markets Share Shocks, But Earnings Sources Are Not Synchronized
The International Monetary Fund projected in July 2026 that the global economy would grow 3% in 2026 and 3.4% in 2027; US growth was forecast at 2.3% for 2026 and China at 4.6%. Energy shocks, trade policy, and geopolitical risks are dampening overall growth, while technology investment in North America and Asia provides partial offset.
This macro mix enters the four markets through different channels. Large US technology companies are absorbing AI capital expenditure, with global revenue and high margins providing an earnings buffer, while high valuations raise the market's requirements for the pace of delivery. Japanese equities sit at the intersection of nominal growth, corporate governance reform, and monetary policy normalization, with improvements in corporate operations and yen movements jointly determining returns for overseas investors. Korean equities are sensitive to memory chip prices, server investment, export orders, and foreign capital flows; profit elasticity stems from higher operating leverage, and earnings contractions also accelerate when the cycle turns. Hong Kong corporate earnings are closely tied to the Chinese economy, while US dollar financial conditions affect valuation discounting, with earnings expectations and risk premiums often acting on prices simultaneously.
The four markets play different portfolio roles. US equities provide sustained earnings and innovation exposure; Japanese equities provide exposure to capital efficiency improvement and interest rate normalization; Korean equities provide exposure to the global semiconductor cycle; Hong Kong equities provide exposure to Chinese assets, dividends, and valuation recovery. Putting assets from all four markets into the same portfolio requires first assessing the degree to which their return sources complement one another, then allocating capital in light of static valuations.
USD-denominated ETFs also incorporate currency effects into final returns. Depreciation of the yen or won erodes local equity market returns for USD investors, while appreciation boosts converted returns. This article selects four US-listed, USD-denominated country or regional ETFs—SPY, EWJ, EWY, and EWH—and uses adjusted prices to calculate USD total returns as representatives of the different country or regional markets. A uniform product format can incorporate dividends, fund fees, tracking error, and exchange rate changes, and is also closer to the actual holding experience of overseas investors and USDT capital. However, although EWH trades in USD like the others, its underlying companies remain affected by HKD interest rates, Chinese demand, and regional capital flows.
Daily tracking also requires putting equities back into a cross-asset context. Using the equities, indices, FX, and precious metals quotes on the same Gate TradFi interface, indices can confirm regional trends, exchange rates such as USD/JPY can decompose equity returns and currency contributions, and gold can be used to observe safe-haven demand. Multi-asset prices provide cross-validation for macro judgments, while corporate earnings and balance sheets still require separate research.
2. Valuation, Earnings, and Capital: Price Differences Stem from Differences in Constraints
Cross-market valuation comparisons often fall into the trap of static multiples. High US index valuations are related to its industry structure, earnings stability, shareholder returns, and global revenue capacity; low Hong Kong market valuations are related to the weight of cyclical industries, risk premiums, earnings visibility, and investor structure. Japan and Korea sit between the two, and are respectively affected by the yen and the semiconductor cycle. P/E differences incorporate the market's comprehensive judgment on growth duration, cost of capital, and governance quality, and cannot be used in isolation from earnings structure.
US equities need to be tested for whether earnings can catch up with valuations. If index gains are accompanied by upward revisions to forward 12-month earnings forecasts, valuation pressure can be gradually absorbed by profit growth; if price gains mainly come from multiple expansion, rising long-term rates will amplify the magnitude of adjustments. When studying large technology companies, capital expenditure, depreciation, cloud business revenue, and free cash flow should be compared. When AI investment can increase revenue or customer retention, capital expenditure is growth investment; when revenue materializes slowly while depreciation rises rapidly, margins will be squeezed.
Japanese equities need to be tested for whether capital governance can change operating efficiency. If low price-to-book companies only increase one-off dividends, valuation improvement may remain short-lived; if companies simultaneously reduce cross-shareholdings, exit low-return businesses, and raise return on invested capital, shareholder returns and operating quality will form a longer improvement cycle. Banks benefit from interest rate normalization but also face credit costs and volatility in bond holdings. Exporters benefit from a weaker yen, while domestic-demand companies rely more on wage growth and households' real purchasing power.
Korean valuations typically swing with the earnings cycle. When semiconductor profits are at a trough, static P/E may appear elevated because the denominator has already contracted; when earnings approach a cyclical peak, static multiples may instead appear low. Valuation judgments need to incorporate inventory, capacity utilization, product prices, capital expenditure, and normalized profits at different stages. High-bandwidth memory demand has expanded the industry's structural growth space, but supply expansion will still determine how long margins can be sustained.
Hong Kong's discount incorporates growth, governance, liquidity, and geopolitical factors. Margin improvement, buybacks, and free cash flow at internet platforms can narrow part of the discount; dividends from banks, telecoms, and energy companies provide holding income, but dividend-paying capacity depends on cash flow and capital constraints. If policy tailwinds do not flow into revenue, profits, and capital flows, valuation recovery tends to remain at the trading stage. The Hong Kong market requires simultaneous observation of earnings forecasts, southbound capital, overseas institutional allocation, and turnover; when all four indicators improve together, the quality of the rally is higher than one driven by a single policy event.
The role of capital flows also differs across the four markets. The US market has a large scale of passive capital, and market-cap weighting reinforces leader performance; overseas capital in the Japanese market is sensitive to exchange rates and governance reform; the Korean market is affected by global tech positioning and foreign risk budgets; Hong Kong absorbs both international capital and capital from mainland China. Capital flows cannot explain all fundamentals, but they determine how quickly earnings changes are reflected in prices.
3. Market Performance: High Returns, High Volatility, and Low Valuation Are Different Dimensions
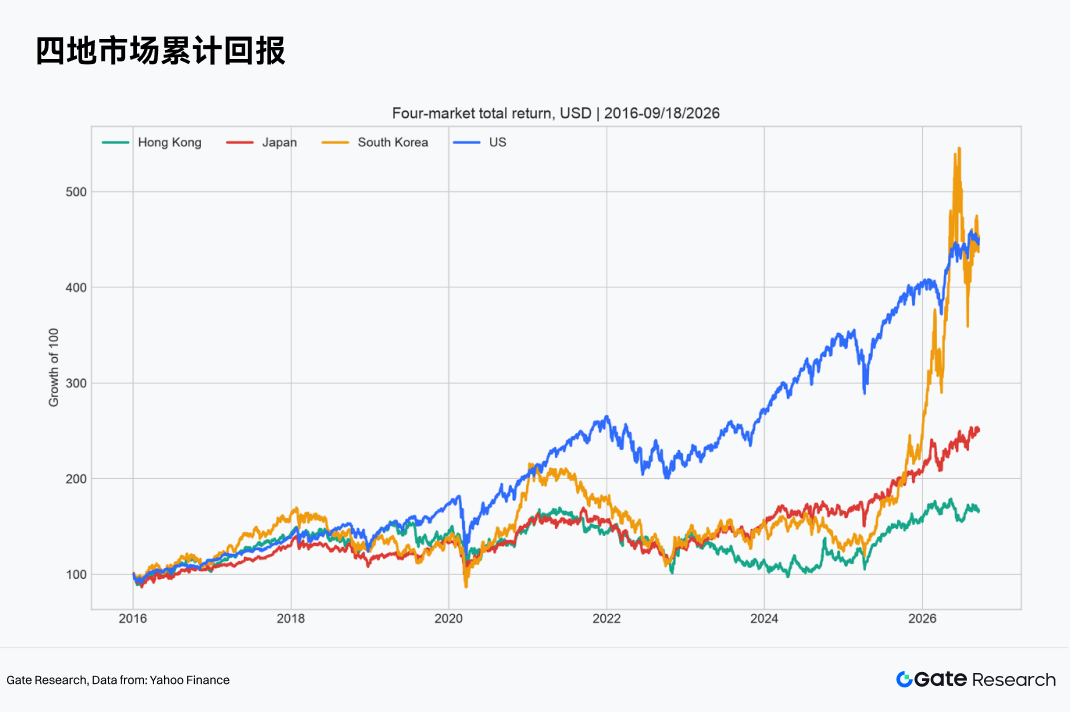
Since 2016, the annualized returns of US and Korean equities have been close, at 14.95% and 14.87% respectively, but the return paths differ greatly. SPY's annualized volatility was 17.73% and its maximum drawdown was 33.72%; EWY's annualized volatility reached 29.42% and its maximum drawdown was close to 49.73%. Similar terminal values do not mean identical risk-adjusted performance. SPY's Sharpe ratio was 0.88, versus 0.62 for EWY. The Korean market provides the portfolio with higher cyclical elasticity but requires stricter position limits and exit rules.
Japan's EWJ delivered positive returns and some diversification value, though long-term returns still lagged the US. The gap is related to industry structure, earnings growth, and exchange rates. The case for allocating to Japanese equities rests on corporate governance, return on capital, and the currency cycle; historical gains alone cannot support future judgments. Annualized returns of 8.77% and a maximum drawdown of 33.14% show that governance improvement can enhance asset appeal but has not eliminated losses from global recessions and liquidity shocks.
Hong Kong's EWH posted annualized returns of 4.66%, annualized volatility of 19.44%, a maximum drawdown of 42.71%, and a Sharpe ratio of only 0.33. Low valuations did not translate into stable risk-adjusted returns. If valuation discounts lack accompanying earnings improvement, cash distribution, and capital inflows, the holding cost will show up in a longer recovery cycle. Hong Kong equities still have portfolio value, but are better suited to an approach combining earnings verification, trend confirmation, and sector selection.
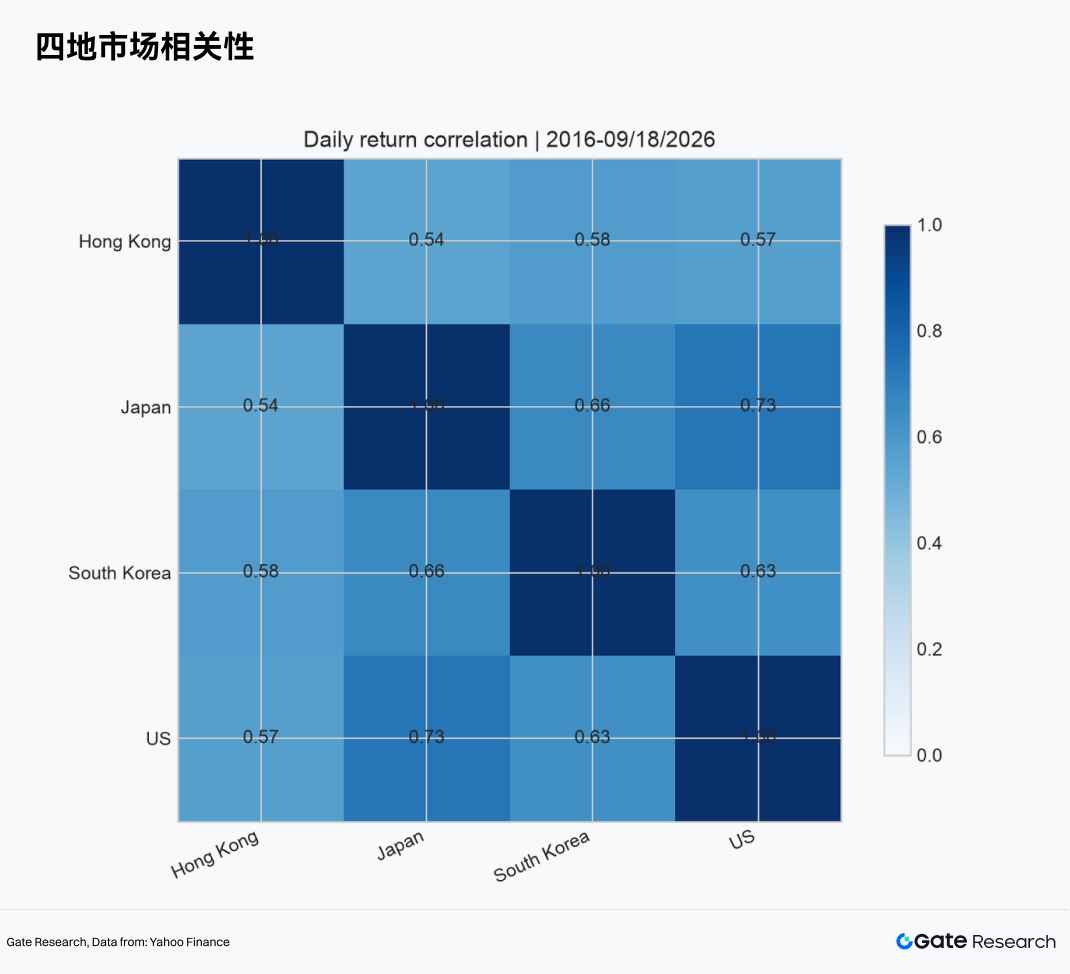
The daily return correlation matrix shows that the four markets share common global risk factors while retaining regional differences. Correlation is insufficient to eliminate systemic drawdowns, especially during liquidity shocks, when correlations across markets often rise in tandem. The main contribution of diversification is to reduce dependence on a single industry and a single policy path; it cannot guarantee complete protection during crises.
Once the above comparisons enter actual trading, the latest prices and trading activity are used to identify short-term conditions, while daily and weekly candlesticks are used to verify trends and drawdowns; all of this information can be checked on Gate TradFi instrument pages. A single-day gain is insufficient to support a medium-term judgment; only when weekly direction, earnings expectations, and industry catalysts support one another does the price signal gain a more solid research foundation.
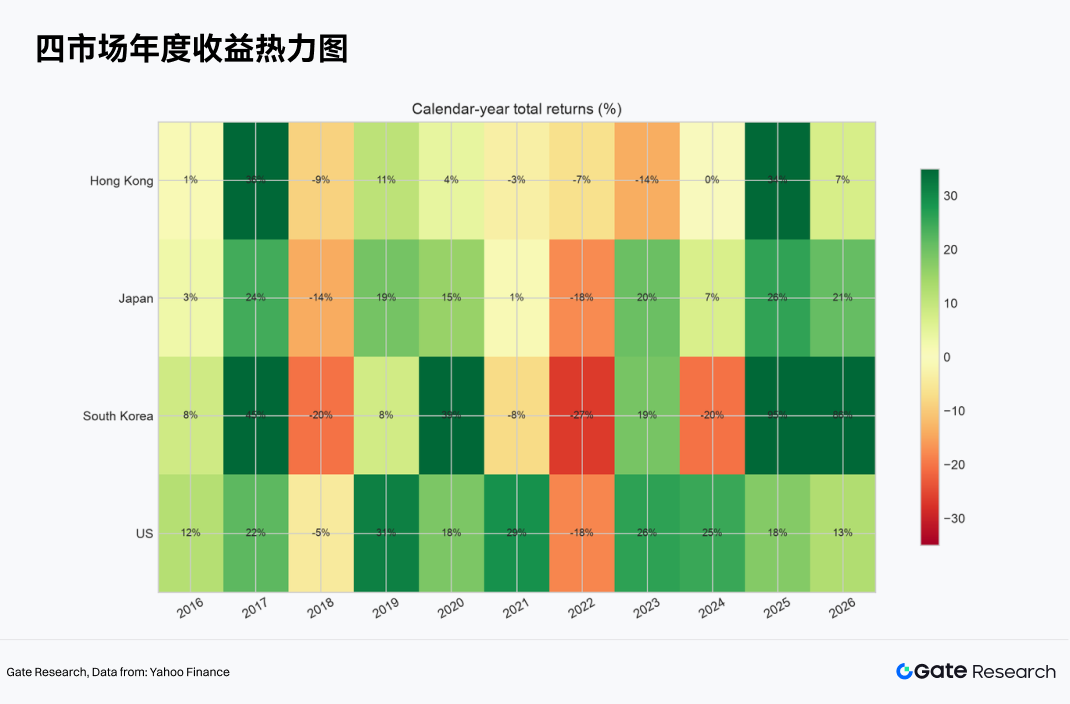
Annual returns further show that market leadership is not fixed. Return gaps in strong years are often caused jointly by industry cycles, exchange rates, and valuation recovery; in stress years, markets may fall in tandem, but the ranking of declines is unstable. If asset allocation is adjusted solely based on the previous year's return ranking, it is easy to add risk at cyclical highs. A robust approach is to decompose annual performance into earnings changes, valuation changes, and exchange rate changes, then judge whether the drivers can persist.
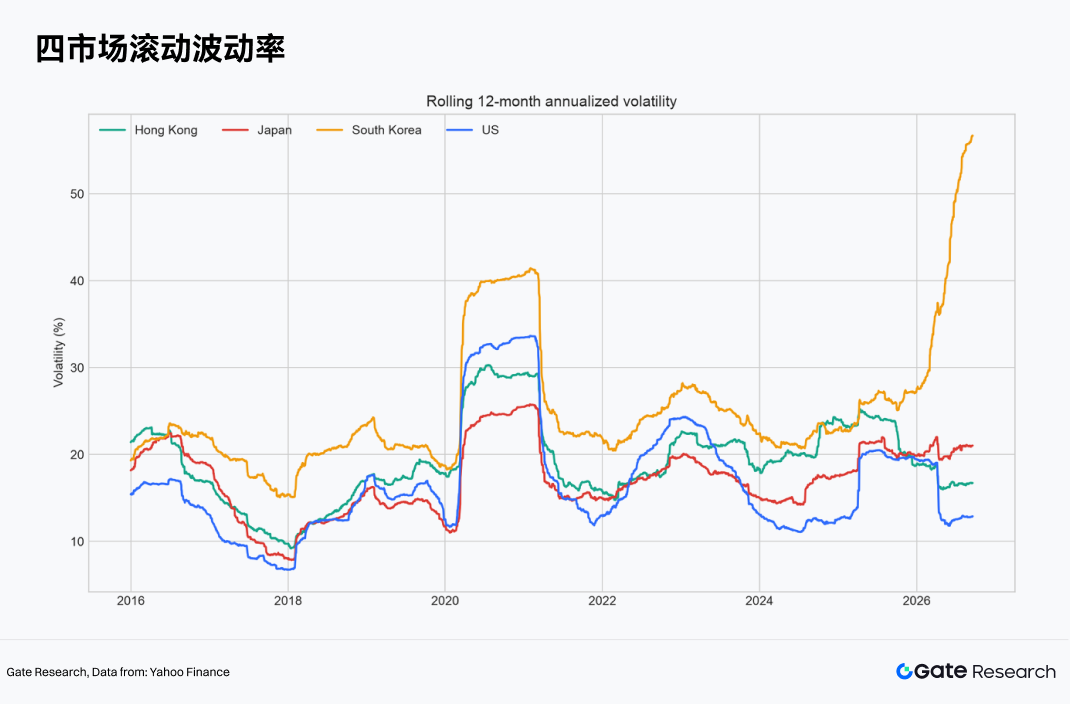
Rolling volatility shows that risk changes with market conditions. Korea's long-term volatility is high, and the gap widens further when the semiconductor cycle changes rapidly; Hong Kong also experiences volatility spikes when policy and growth expectations are repriced; long-term volatility in the US and Japan is relatively similar, though both rise together during crises. Fixed positions cause portfolio risk to drift with market conditions; inverse-volatility allocation can reduce the weight of high-volatility assets but may also miss their return-generating phases.
4. Market Structure: The US Relies on Earnings Compounding, Asia on Cycles and Repricing
The long-term advantage of US equities comes from the combined effect of corporate earnings, return on capital, and the index rebalancing mechanism. Large technology platforms, semiconductor companies, and high-quality service firms generate strong free cash flow, and market-cap-weighted indices automatically increase the weight of winning companies. This mechanism improves long-term efficiency but also creates concentration in leaders. When AI capital expenditure can be converted into cloud service revenue, software payments, and productivity gains, high valuations can be absorbed by earnings growth; when investment returns fall short of expectations, the index will face both earnings downgrades and valuation compression.
Analyzing US equities requires observing the gap between capital expenditure growth and revenue growth, free cash flow coverage, index market breadth, and equal-weight index performance. If index gains depend mainly on a handful of companies, the portfolio can still retain core positions, but new capital should slow its pace of chasing prices. If earnings upgrades spread to industrials, financials, software, and small- and mid-cap companies, the structure of the rally will be healthier.
When observing the US market on Gate TradFi, broad-based assets, the technology sector, and high-weight companies can be divided into three layers. When broad-based indices rise while most individual stocks weaken, the concentration risk borne by index positions increases; when leader earnings upgrades drive more industries higher, the broad-based signal gains broader support. The platform serves as the entry point for quotes and trading, while layered observation determines whether positions need to follow index changes.
The research focus for Japanese equities is whether capital governance can generate per-share value growth. Buybacks and dividends can improve shareholder returns, while asset sales, reduced cross-shareholdings, and exits from low-return businesses affect long-term capital efficiency. The Tokyo Stock Exchange continuously publishes statistics on market trading, market capitalization, and yields, providing official data to test the effects of reform. Interest rate normalization helps banks' net interest margins but may pressure high-valuation stocks and raise financing costs. A weaker yen benefits the translation of exporter profits but also raises the cost of imported energy and raw materials. Within Japanese equities, risk should be allocated among financials, industrials, exporters, and domestic demand.
The roughly 300 Japanese stocks that first entered Gate's equity system cover markets such as the Tokyo Stock Exchange Prime Market, including large companies such as Toyota, Sony, SoftBank Group, Mitsubishi UFJ Financial, Nintendo, and Tokyo Electron. The structure of these key listed instruments corresponds to several main threads in Japanese equity research: autos and electronics bear the export cycle, banks correspond to interest rate normalization, gaming and internet reflect global consumer demand, and semiconductor equipment connects to AI capital expenditure. Index views can thus be pushed down to the company level to judge whether gains are driven by currency translation or supported by improved operating returns.
Korean equity returns are highly dependent on the semiconductor cycle. AI servers increase demand for high-bandwidth memory, and chip prices, inventory, and capacity utilization jointly determine profit elasticity. Share prices typically lead financial statements, and looking only at reported earnings can easily miss cyclical turning points. Research should simultaneously track memory prices, Korean semiconductor exports, corporate inventory days, capital expenditure guidance, and major customer orders. EWY's official materials show that it provides exposure to large- and mid-cap Korean stocks, and its three-year historical volatility is significantly higher than that of broad-based assets in mature markets, consistent with the high-volatility characteristics obtained in this article's long-term backtest.
In practical observation of the Korean market, Gate TradFi can further distinguish whether index changes stem from semiconductor leaders or from joint improvement in autos, batteries, financials, and consumer sectors. If gains are concentrated in a few high-weight companies, broad-based positions still carry high single-industry risk; industry diffusion indicates that the export boom is beginning to feed into broader corporate earnings.
Hong Kong equity pricing is jointly affected by Chinese corporate earnings, US dollar interest rates, and investor risk premiums. Statistics from Hong Kong Exchanges and Clearing show that in 2025 Hong Kong ranked among the top global exchanges by IPO fundraising size, indicating some recovery in primary market financing functions. Whether the secondary market can generate sustained returns still requires observation of platform company revenue and buybacks, cash flow coverage of high-dividend companies, and the stability of China's consumption and real estate chains. Internet, high-dividend, and macro-cyclical sectors each have their own cash flow characteristics and risk sources, and require separate signals and risk budgets.
When selecting Hong Kong equity instruments on Gate TradFi, internet platforms, high-dividend financials, and cyclical industries should be placed into independent watchlists to avoid summarizing internal structure with a single move in the Hang Seng Index. Candlesticks are used to confirm whether prices have formed a medium-term trend, while earnings, buybacks, and dividend-paying capacity are still verified through company disclosures. Handled this way, platform quotes become price evidence in the research chain and do not replace fundamental conclusions.
5. Cross-Market Transmission: Independent Cycles Remain Beneath Common Factors
US technology capital expenditure and Korean semiconductor earnings form a demand-side and supply-side link. Higher server investment by cloud platforms can drive demand for high-bandwidth memory and advanced packaging; chip company profits also depend on supply discipline, yields, and product mix. A rise in US tech stocks does not guarantee a simultaneous rise in Korean equities; the supply chain signal is complete only when capital expenditure, chip prices, and export volumes improve together. Holding assets from both markets in the same portfolio increases exposure to the AI factor, and apparent country diversification may mask industry concentration.
The relationship between Japanese equities and the yen differs by industry. Yen depreciation raises the translated value of export revenue but pushes up the cost of imported energy and raw materials; yen appreciation benefits the exchange-rate returns of USD investors but may pressure exporter profit expectations. When analyzing EWJ, local equity performance and currency contribution should be separated. If Japanese equities rise in local currency but USD-denominated performance is flat, the returns obtained by overseas investors are mainly offset by exchange rates. If the yen and equities rise together, it often corresponds to overseas capital inflows or greater recognition of the domestic demand and governance thesis.
The Hong Kong market is affected by both US discount rates and the Chinese earnings cycle. Rising US dollar interest rates raise the discount rate for Hong Kong equity valuations, while slowing Chinese growth lowers corporate earnings expectations; when the two factors move in the same direction, valuations and profits may contract simultaneously. If US rates fall while Chinese earnings remain stable, Hong Kong equities have conditions for valuation recovery; if the rate decline stems from a global recession, a lower discount rate may not offset earnings downgrades. Only by placing the direction of interest rates within the cause of growth can reliable conclusions be formed.
Correlations across the four markets provide room for diversification in calm periods but may rise during crises. Trend screening allows the portfolio to reduce weak assets, lowering reliance on constant correlation. Allocation models still need to identify duplicated factors: SPY and EWY may share exposure to AI investment, EWJ and EWY share exposure to global manufacturing, and EWH is closely