Gate Research: Risk assets rose overall in August, trend momentum strategy performed steadily


- Key Takeaways: In August, BTC rose 25.1% and ETH rose 32.6% in the crypto market, with returns highly concentrated in the second half of the month. The rally was accompanied by leverage expansion and short liquidations; the trend was strong but sensitivity to deleveraging increased. US equities rose modestly, with divergence among tech stocks.
- Key Elements:
- ETH's monthly gain exceeded BTC's by approximately 7.5%, with annualized volatility of 71.8% versus BTC's 43.3%, and a single-day maximum gain of 17.5%.
- Open interest for BTC and ETH on Gate grew 9% and 12.1% respectively, remaining near monthly highs at month-end, indicating concentrated leveraged positions.
- The account long/short ratio leaned long (BTC 1.3, ETH 1.48), but the taker buy/sell ratio was below 1 (0.94, 0.92), with large trades skewed toward selling.
- On August 20, total network liquidations reached approximately $2.99 billion, of which $2.74 billion were shorts, creating brief passive buying that pushed prices higher.
- Funding rates were mildly positive for most of the time (BTC 83%, ETH 87% of days), with the market generally bullish but not at extremes.
- NAS100 led with a 4.2% gain, but TSLA rose 18.2% and NVDA rose 10%, while GOOGL and AMZN fell 4.7% and 4.3% respectively, showing clear divergence among individual stocks.
- Backtesting shows the 100-day moving average plus 20-day momentum strategy delivered positive returns across all eight evaluation units, with a median maximum drawdown of 8.71%, and was selected as the recommended model.
Summary
• BTC rose about 25.1% in August, while ETH rose about 32.6%. ETH's gains and volatility were both higher than BTC's, with most of the returns concentrated in the second half of the month.
• Gate's BTC and ETH open interest grew by about 9% and 12.1%, respectively. Funding rates remained mildly positive for most of the period, and long positions dominated in account count, though aggressive selling volume remained substantial.
• On August 20, a large-scale short liquidation event swept the entire market, creating strong passive buying demand. Liquidation volume declined by month-end, but elevated open interest could still amplify future price volatility.
• NAS100 rose about 4.2% in August, outperforming US500 and US30. Large-cap tech stocks diverged: TSLA, NVDA, and MSFT gained, while GOOGL and AMZN declined.
1. August Market Overview
1.1 Cross-Asset Prices and Volatility
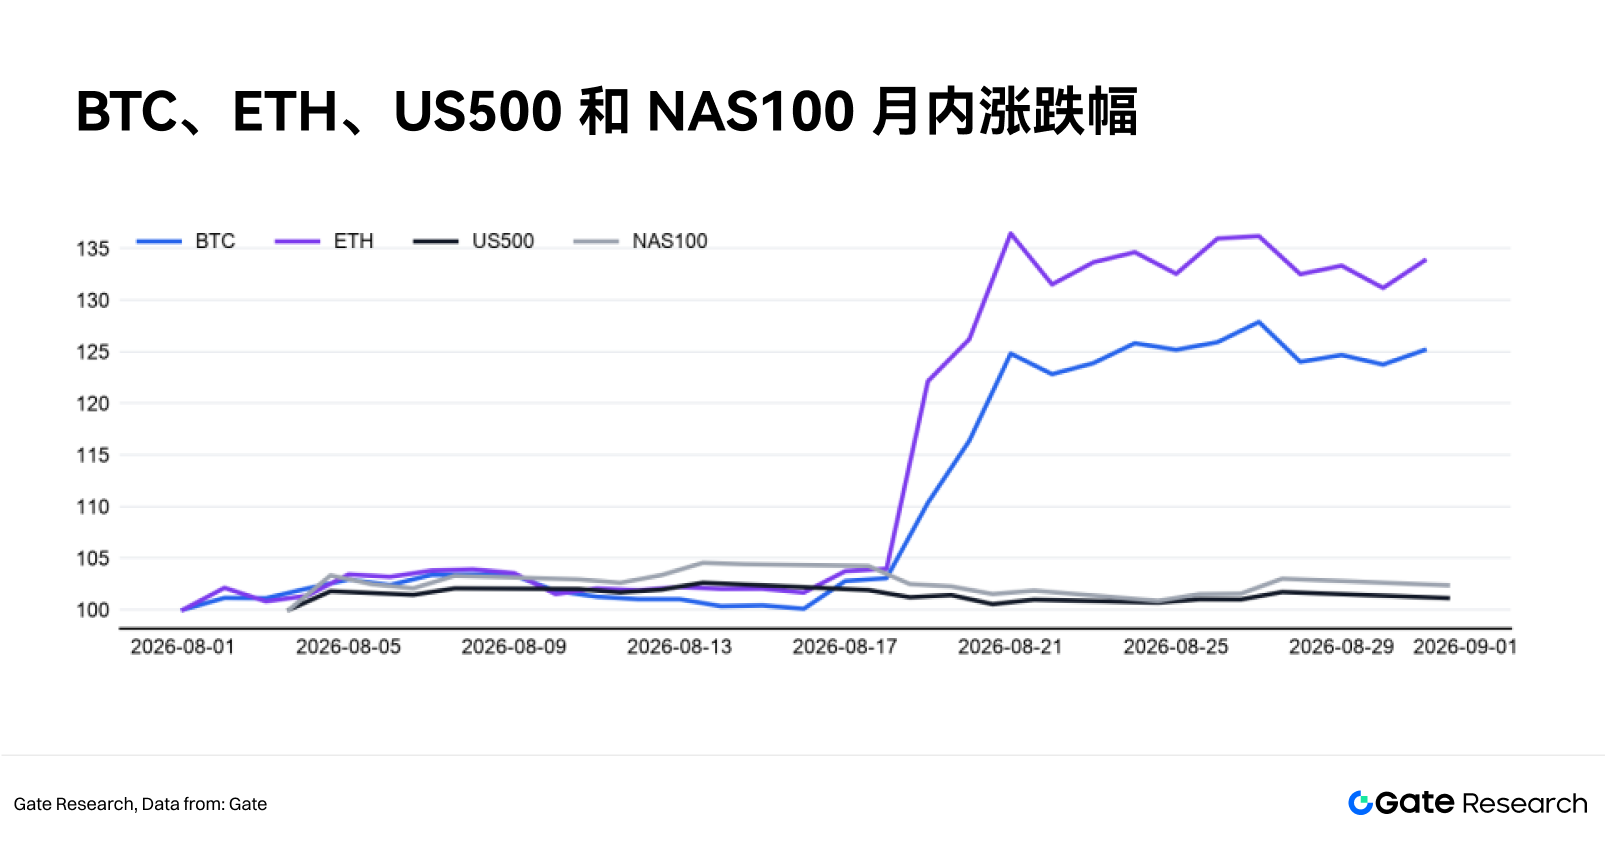
BTC peaked at around $81,347 during August and closed at around $78,549. Its maximum intra-month drawdown was 3.2%, and the overall uptrend was relatively continuous. BTC rose about 25.1% for the month, while ETH rose about 32.6%, with ETH's monthly gain 7.5% higher than BTC's. The annualized realized volatility of BTC and ETH was approximately 43.3% and 71.8%, respectively, a difference of 28.5%. ETH's largest single-day gain reached 17.5%, indicating that a portion of this month's returns was concentrated in a few fast-rising trading days. The market was relatively calm before mid-month, with most of the gains concentrated in late August.
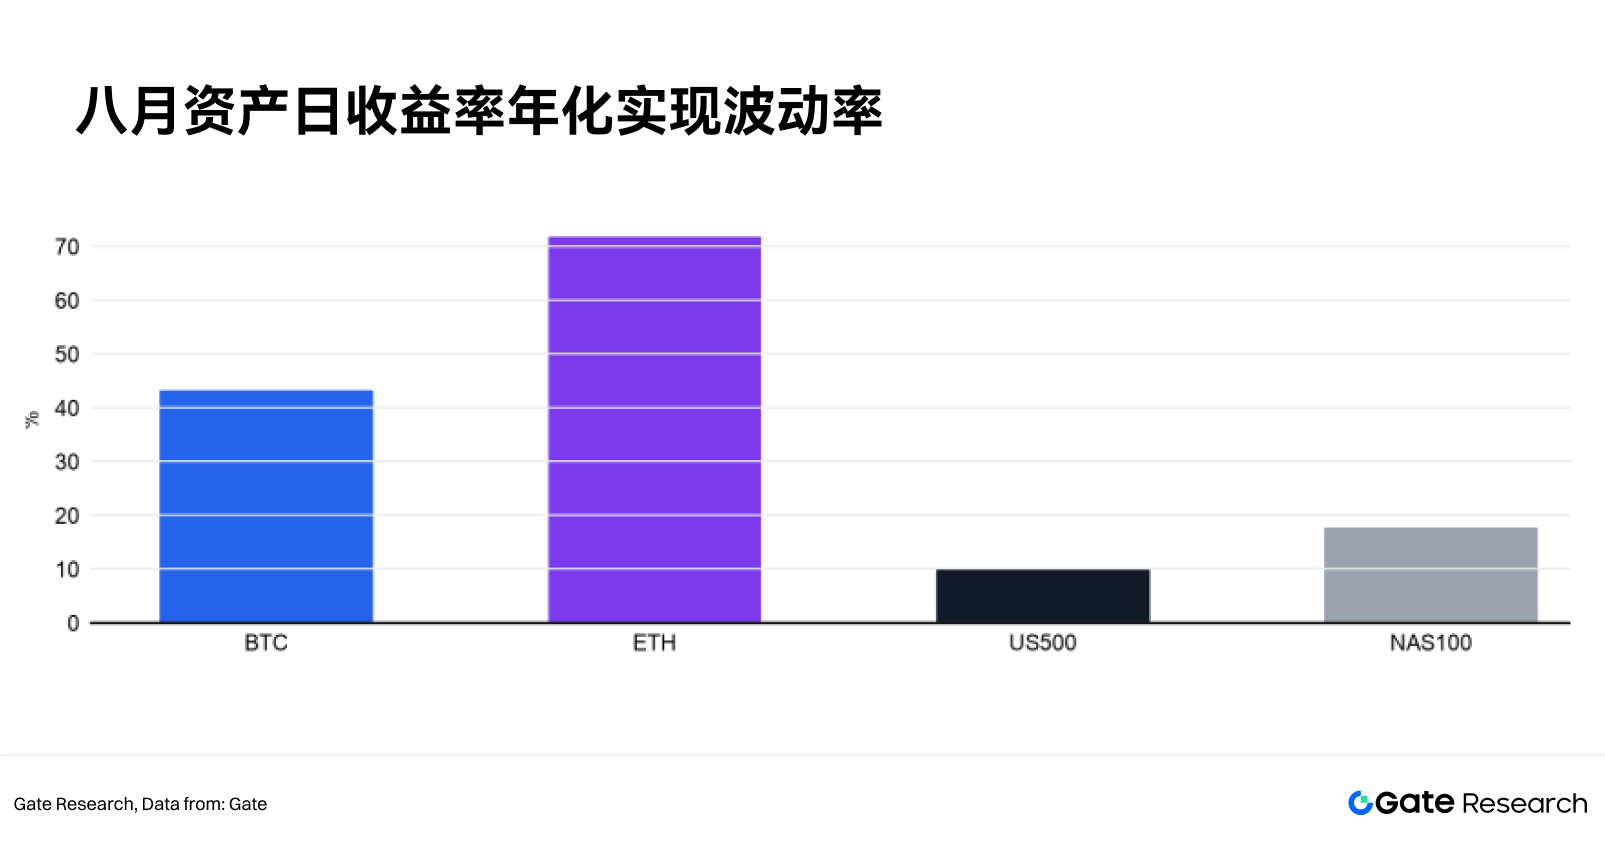
The US500 index posted smaller gains than crypto assets and traded much more smoothly. NAS100's volatility was 17.7%, roughly 1.8 times US500's 9.9%, with deeper intra-month drawdowns, mainly because NAS100 contains more tech and growth companies that are more sensitive to interest rates, AI investment, and large-cap tech earnings. In August, capital preference remained concentrated in faster-growing, higher-attention companies, but performance varied considerably across individual names.
1.2 Derivatives Pricing, Positioning, and Fragility
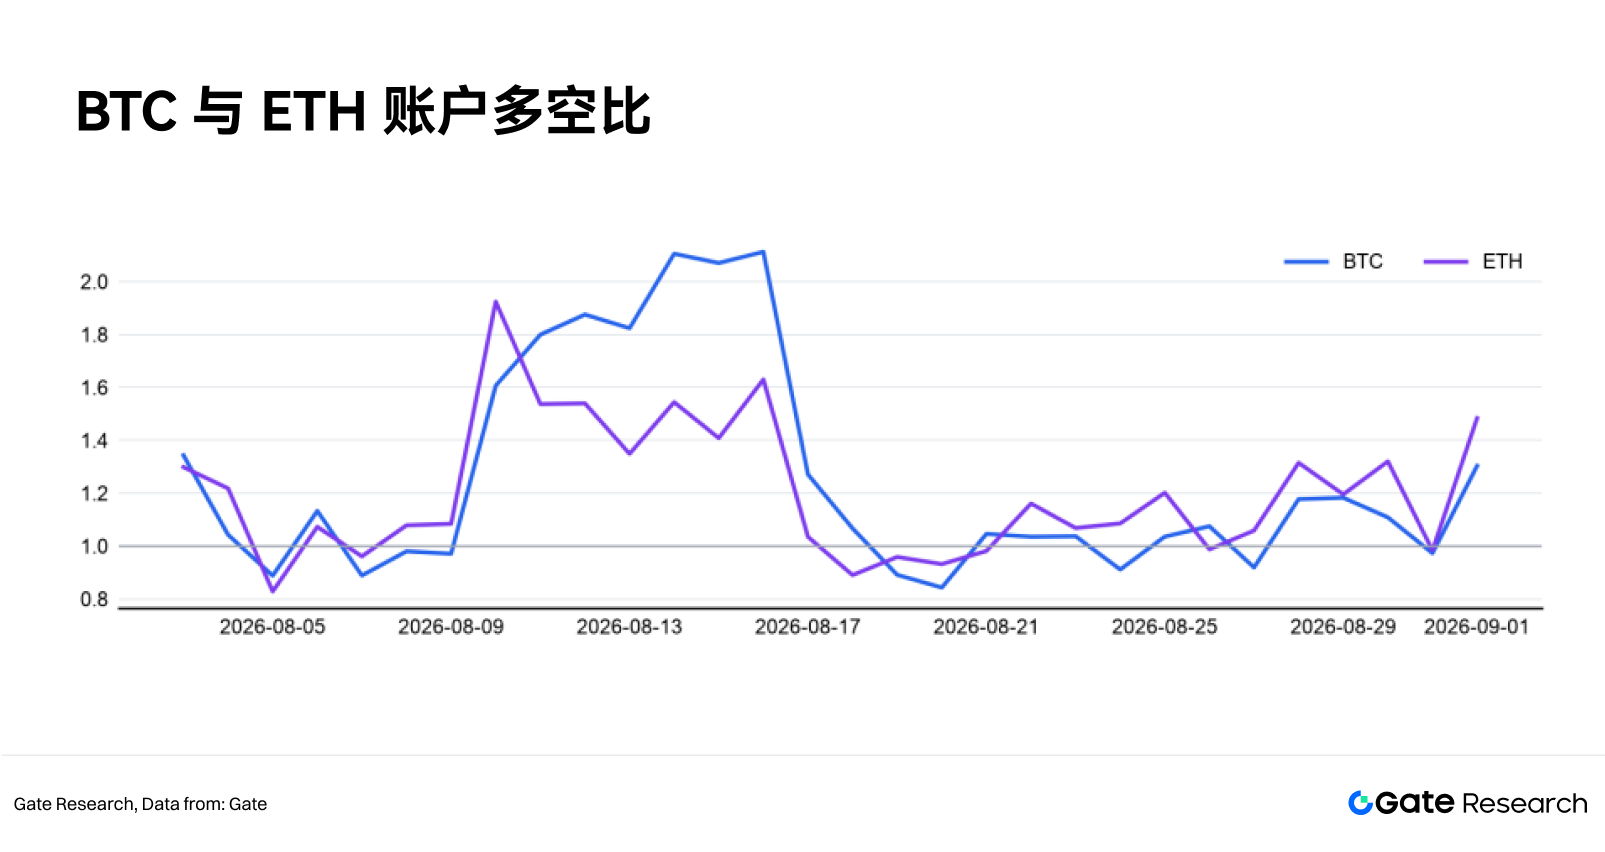
BTC's account long/short ratio averaged 1.25 for the month and stood at 1.3 at month-end; ETH averaged 1.2 and rose to 1.48 by month-end. Long accounts outnumbered shorts, but BTC's taker long/short ratio averaged only 0.94 for the month, and ETH's was 0.92, with aggressive selling exceeding aggressive buying on most days. The divergence between account counts and trading volume suggests that many accounts maintained a net long bias, while larger trades or position reductions leaned toward selling.
In August, long accounts were more numerous, but aggressive selling volume remained relatively large. Possible reasons include profit-taking after the rally, hedging, and position reduction by some large holders. Although this did not prevent prices from rising, it shows that buyers did not consistently hold absolute dominance. If prices continue to rise in September while the taker long/short ratio returns above 1, the rally would receive stronger volume support; if prices weaken while the ratio stays below 1, selling pressure could accelerate a pullback.
1.3 Position Expansion and Trend Quality
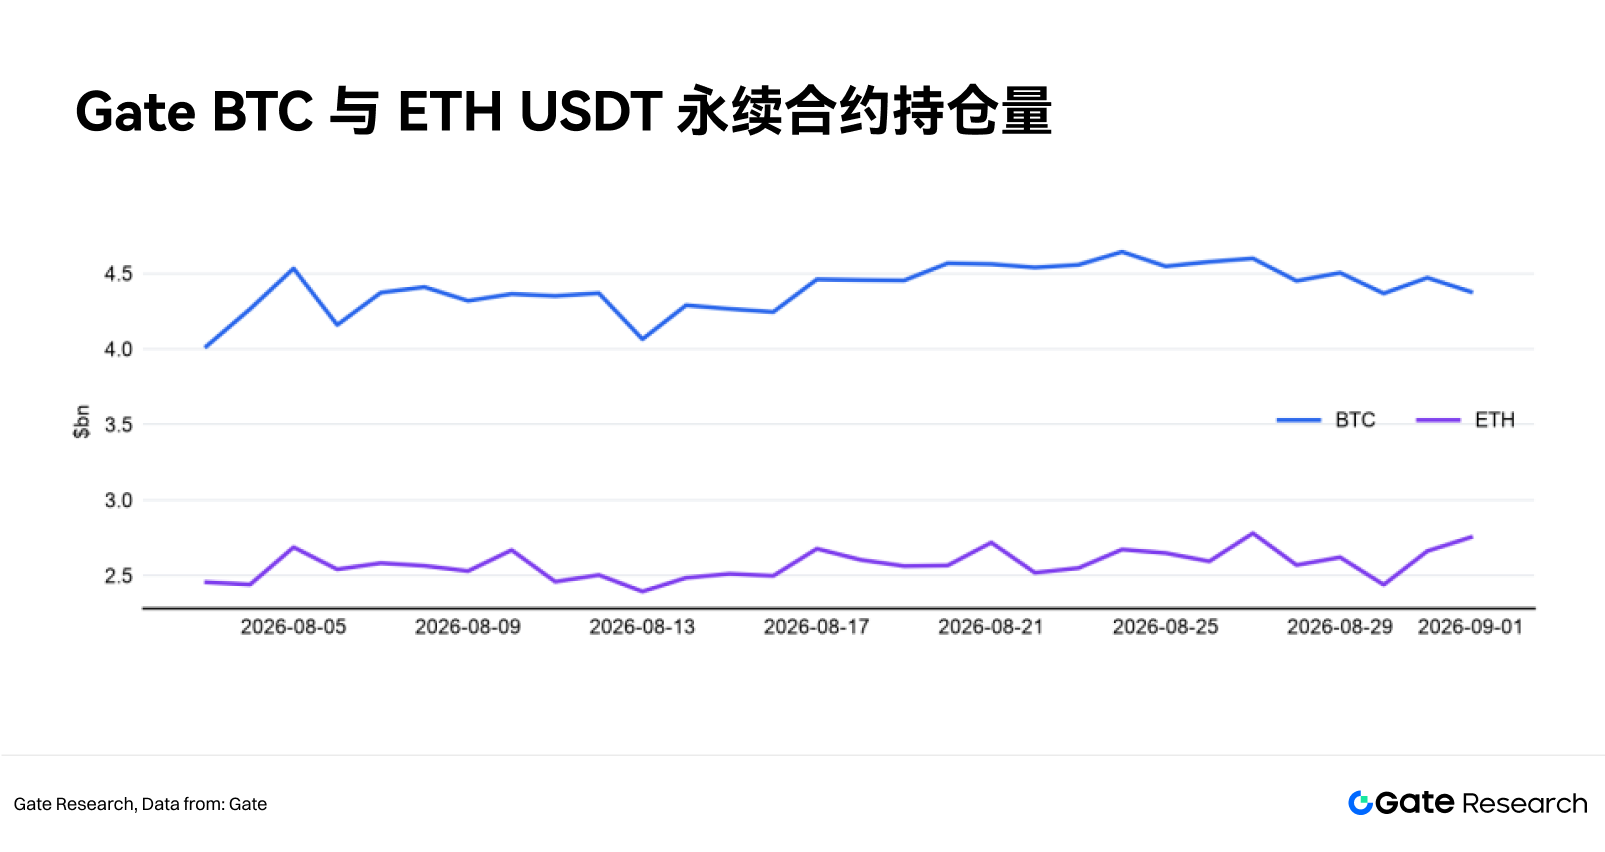
On Gate, BTC open interest rose from about $4.02 billion at the start of the month to $4.38 billion at month-end, a 9% increase, with an intra-month peak of $4.64 billion. ETH rose from $2.46 billion to $2.75 billion, a 12.1% increase, with a peak of $2.78 billion.
For most of August, prices and contract open interest rose together, which typically indicates new capital entering the futures market and suggests the rally was not driven entirely by old shorts closing out. However, since open interest is denominated in USD, rising coin prices themselves push the dollar value higher. Open interest remained near intra-month highs at month-end, indicating high market participation. It is worth noting that if prices fall rapidly, highly leveraged positions could be reduced simultaneously, amplifying short-term declines.
1.4 Funding Rates and Crowding Filters
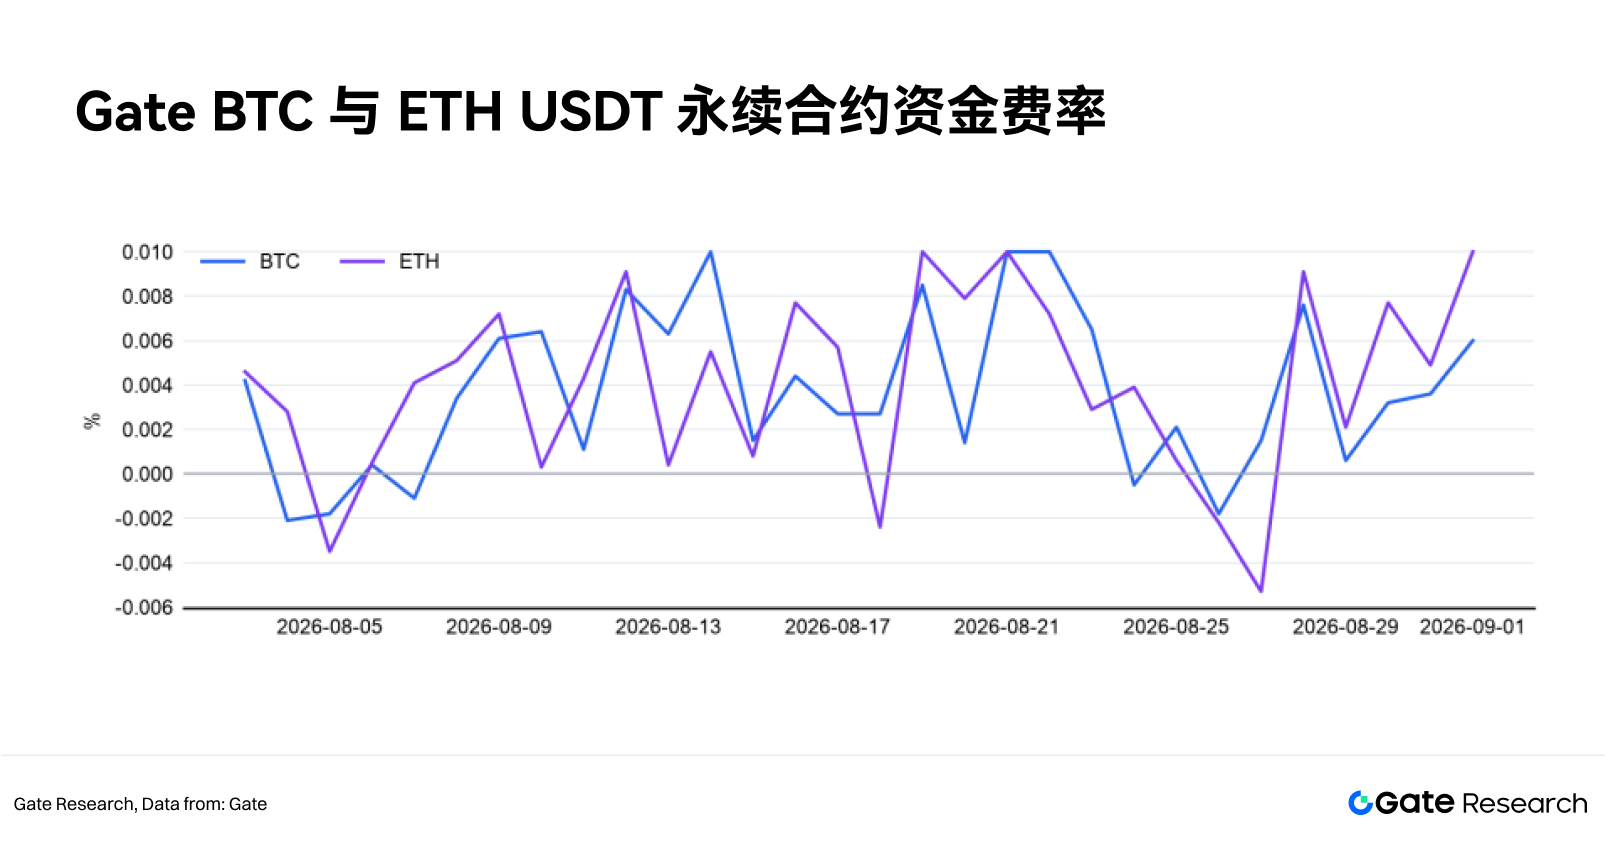
BTC's funding rate averaged about 0.0037% for the month, positive on 83% of days; ETH averaged about 0.004%, positive on 87% of days. A positive rate means longs typically pay shorts, indicating an overall bullish market bias. Funding rates remained mildly positive for most of August and did not stay at extreme levels for extended periods. ETH's rate rose toward month-end, consistent with ETH's widening gains in the second half and increased contract trading activity.
Looking ahead, if funding rates rise rapidly and stay elevated while open interest continues to grow, leveraged trading could become crowded; if rates decline while prices remain stable, market pressure would ease somewhat.
1.5 Market-Wide Liquidation Shock
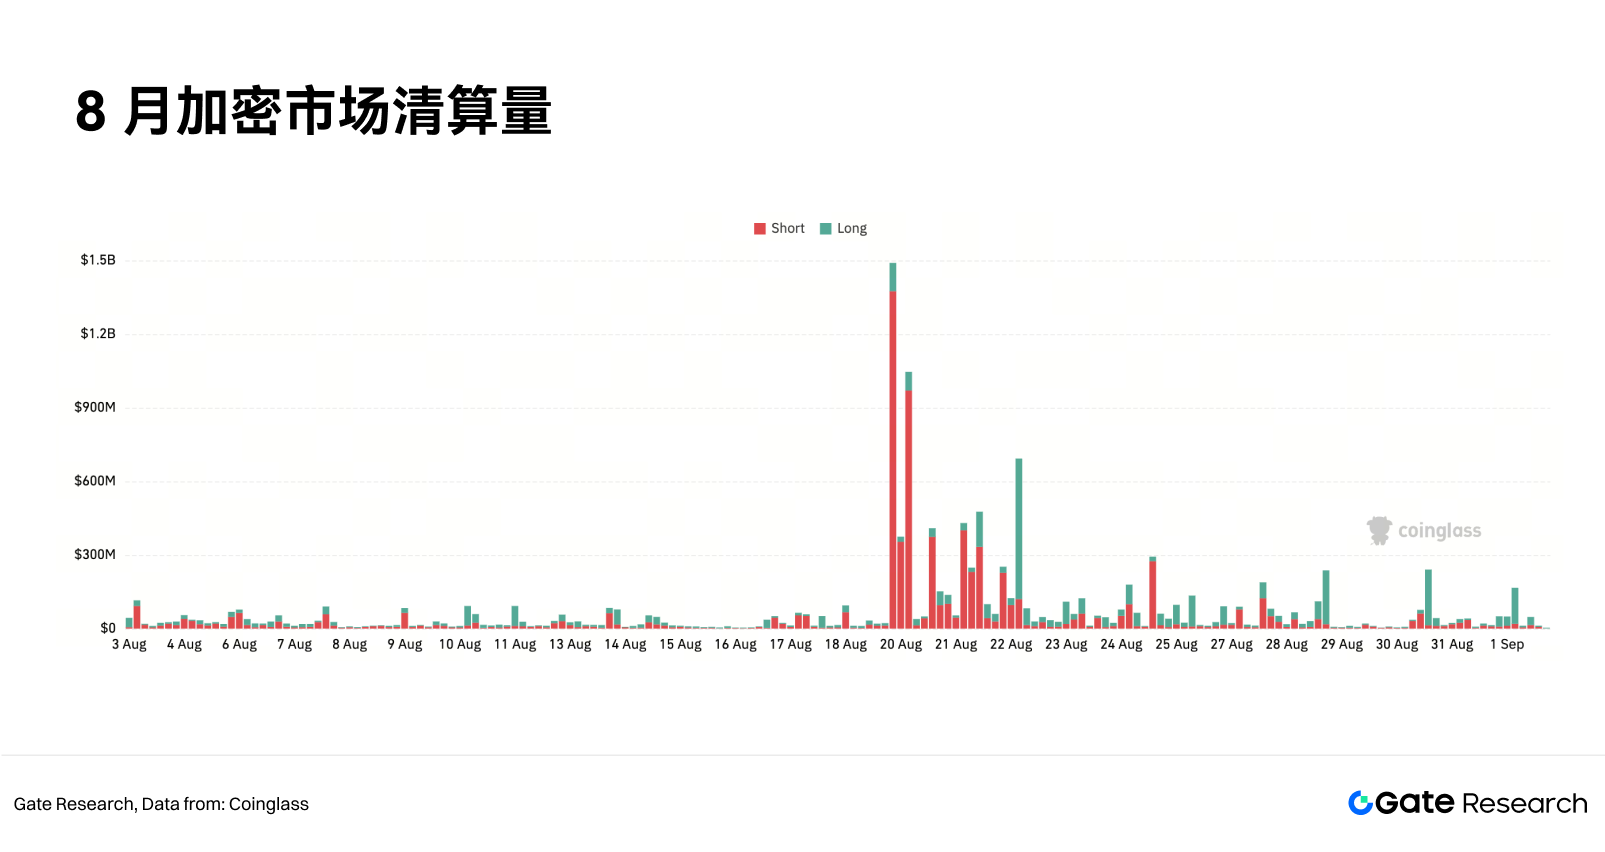
The large short liquidation event around August 20 was one of the most notable market events of the month. Total market-wide liquidations that day were about $2.99 billion, of which shorts accounted for about $2.74 billion; the following day, August 21, total liquidations were about $1.24 billion, with shorts at about $1.06 billion. When shorts are forcibly liquidated, they must buy back contracts, which continues to push prices higher in the short term. Such buying is not long-term investment capital and fades quickly once liquidations end.
Additionally, increased long liquidations on August 23 indicate that momentum-chasing capital was also hit by the pullback. Liquidation volume dropped significantly by month-end, and the market shifted from a violent squeeze back to a relatively calm state, but the risk left by elevated open interest has not fully dissipated.
1.6 TradFi Major Indices and Stocks
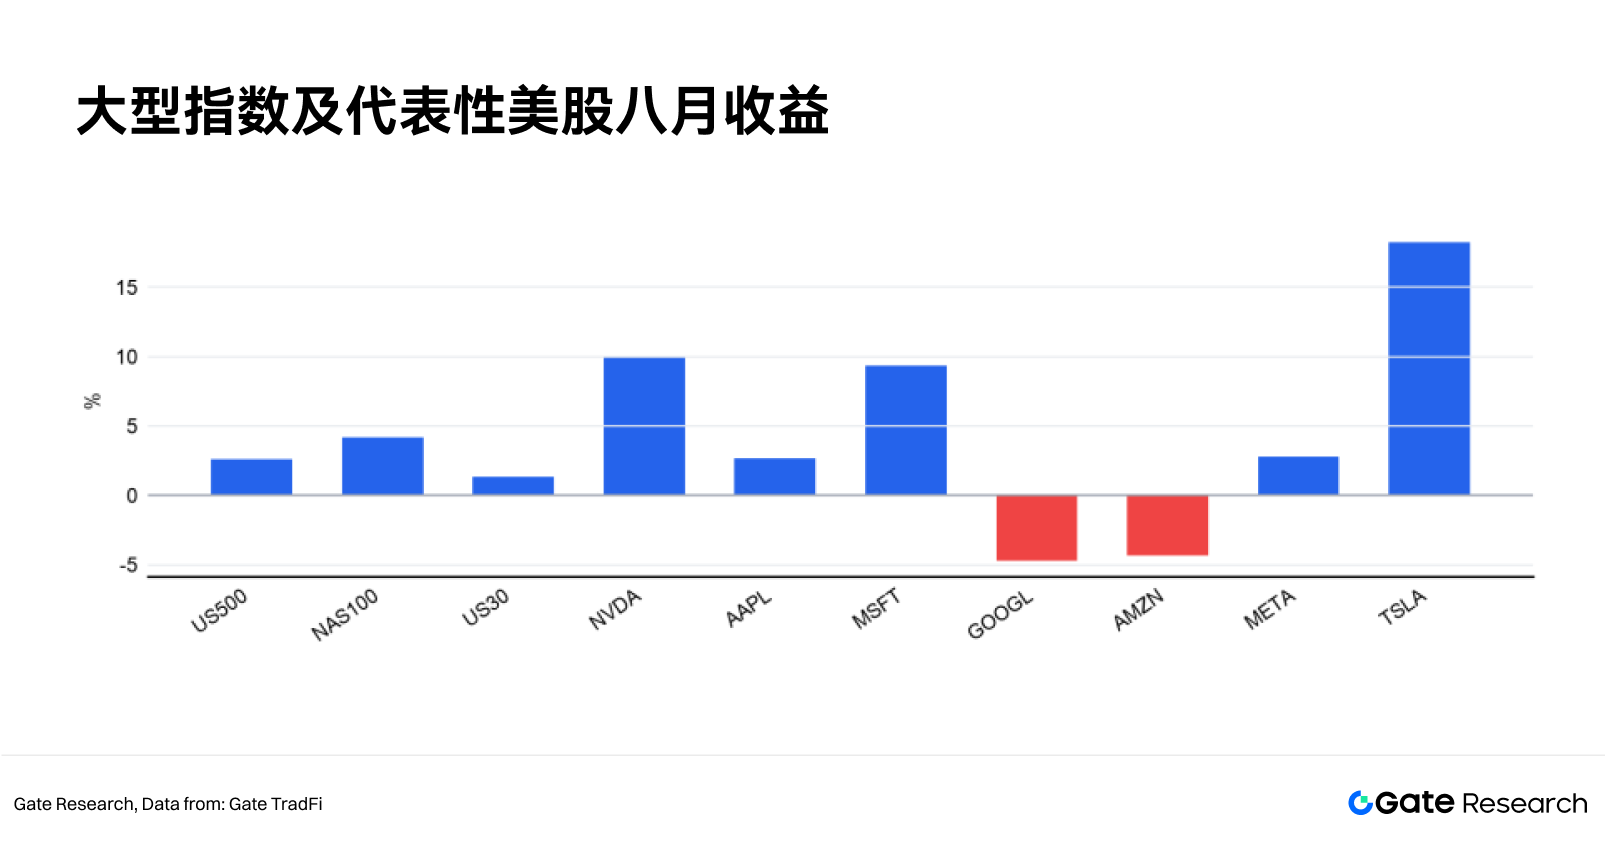
NAS100 rose 4.2%, leading US500 by about 1.6%, while US30 gained 1.3%. Divergence among individual stocks widened: TSLA rose 18.2%, NVDA gained 10%, and MSFT added 9.4%; GOOGL and AMZN fell 4.7% and 4.3%, respectively.
August's US stock rally was led mainly by tech and high-growth companies, but not all large-cap tech stocks rose. TSLA, NVDA, and MSFT outperformed, while GOOGL and AMZN declined. At the index level, gains continued, but at the individual stock level, divergence was pronounced. This phenomenon suggests investors remain bullish on AI and select growth companies while becoming more discerning about valuations, earnings, and future spending.
2. Quantitative Strategy Screening
2.1 Candidate Models
Candidate 1: 20-day and 80-day exponential moving average trend, with faster response;
Candidate 2: Dual momentum with close above the 100-day moving average and positive 20-day return;
Candidate 3: Donchian model with 55-day breakout entry and 20-day low exit;
Candidate 4: Mean reversion with 14-day RSI below 30 entry and above 55 exit.
Model selection considers three things: whether risk-adjusted returns are favorable, whether the proportion of profitable outcomes across different assets is high enough, and whether losses can be controlled at their deepest. The Sharpe ratio is used to compare returns and volatility—higher values are generally better; maximum drawdown represents the largest loss from peak to trough.
2.2 Testing Process and Results of Candidate Strategies
This comparison uses four asset classes: BTC, ETH, US500, and NAS100. Each strategy is run across two periods: the first from January to December 2025, and the second from January to August 2026. Four asset classes multiplied by two periods gives eight evaluation units per strategy.
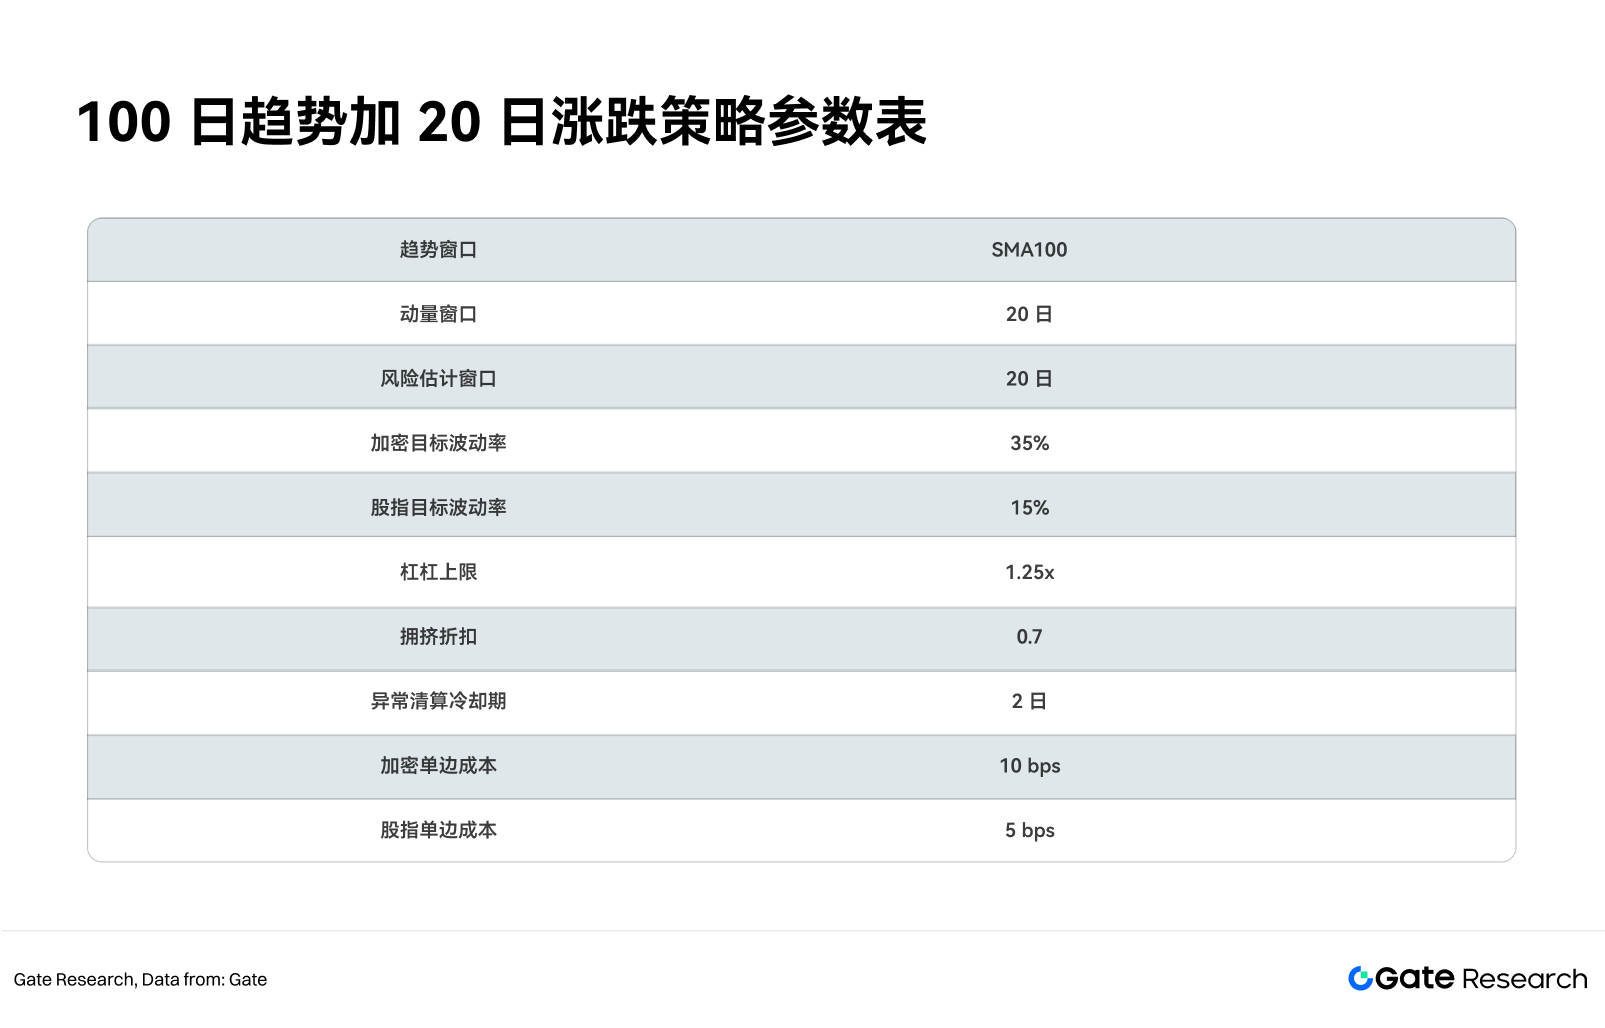
All strategies use identical backtesting rules. Signals are calculated after each day's close and executed on the next trading day; when there is no buy signal, the strategy holds cash and only goes long, never short. Position sizing is adjusted based on 20-day volatility: target annualized volatility is set at 35% for BTC and ETH, and 15% for US500 and NAS100, with a maximum position of 1.25 times account equity per asset. Each position adjustment incurs trading costs: 0.1% of traded value for crypto assets and 0.05% for stock indices. Returns are calculated continuously based on daily net strategy returns, so results already account for signal delays, position changes, and trading fees.
Candidate strategies are compared across three dimensions. The first is the median Sharpe ratio across the eight evaluation units, used to observe returns per unit of volatility borne; the second is the positive return ratio, i.e., the proportion of the eight evaluation units with cumulative returns greater than zero; the third is the median maximum drawdown, used to measure the magnitude of losses during unfavorable market conditions. The composite score is calculated as:
Composite Score = Median Sharpe Ratio + Positive Return Ratio + 0.25 × (1 − Absolute Value of Median Maximum Drawdown)
This score is only used for relative ranking among the four strategies in this analysis. It is not a return forecast, win-rate prediction, or prediction of future performance.
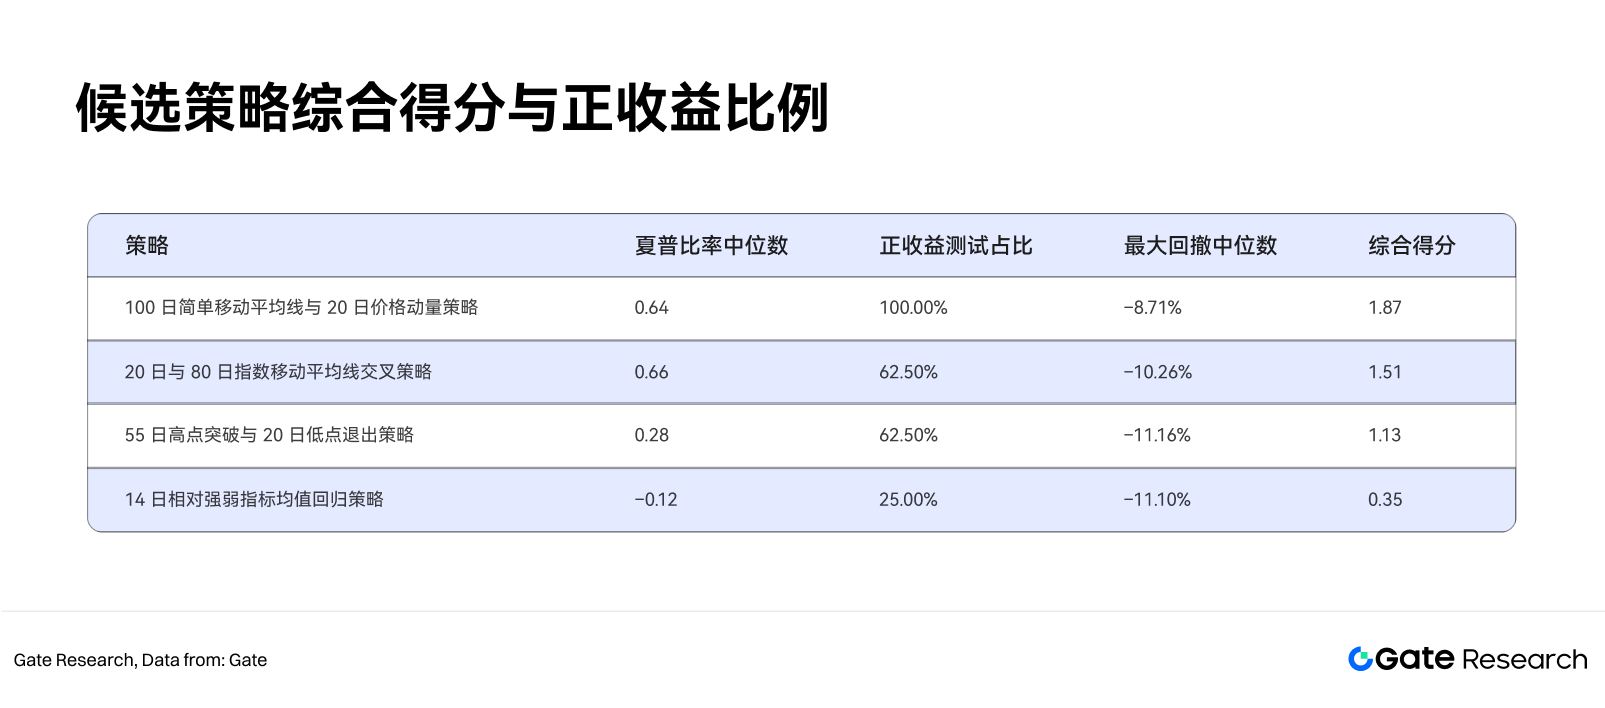
The 100-day moving average plus 20-day momentum strategy had a median Sharpe ratio of 0.64 and a median maximum drawdown of 8.71%. Breaking it down, the strategy achieved cumulative returns of 4.61%, 9.07%, 5.99%, and 8.47% on BTC, ETH, US500, and NAS100, respectively, in 2025; and cumulative returns of 12.12%, 10.68%, 5.83%, and 2.93%, respectively, from January to August 2026. Return levels varied across assets, but no single asset or evaluation period completely dragged down the results.
The 20-day and 80-day moving average strategy had a median Sharpe ratio of 0.66, slightly higher than the 100-day moving average plus 20-day momentum strategy, but its positive return ratio was 62.5%. Losses occurred primarily in both BTC periods and the ETH 2026 evaluation period, indicating that faster moving average signals are prone to frequent position changes when crypto assets oscillate repeatedly.
The 55-day breakout with 20-day low exit strategy also had a positive return ratio of 62.5%, but its median Sharpe ratio was only 0.28. This strategy requires prices to first break above a longer-term high before buying, typically holding cash during periods without clear trends; after false breakouts, it may also sustain losses before an exit signal arrives.
The RSI rebound strategy had a positive return ratio of 25% and a median Sharpe ratio of -0.12, the lowest composite score. This strategy was able to capture short-term rebounds after pullbacks in some phases for US500 and NAS100, but performed weakly on BTC and ETH. In uptrends, RSI quickly exceeds the exit threshold, causing the strategy to sell prematurely; during sustained declines, RSI entering low territory does not guarantee an immediate price rebound.
After comprehensive comparison, the 100-day moving average plus 20-day momentum strategy was selected for subsequent analysis. The basis for selection was not its highest Sharpe ratio in any single dimension, but rather its 100% positive return ratio, combined with a lower median maximum drawdown and relatively stable cross-asset performance. It should be noted that to further confirm strategy stability, it would be necessary to re-select parameters using rolling windows and continue testing with new data not involved in any parameter comparison.
2.3 Recommended Strategy Overview and Core Parameters
Based on the test results, the recommended model is the 100-day trend plus 20-day momentum strategy. It first determines whether the price is above the past 100-day average, then checks whether the most recent 20 days have been positive. When both conditions are met, buy on the next trading day; when either condition is not met, sell and hold cash. The greater the market volatility, the less capital is deployed; the lower the volatility, the more capital can be deployed. No asset's allocation exceeds 1.25 times account equity. BTC and ETH are controlled at a 35% target volatility, while US500 and NAS100 are controlled at 15%.
2.4 Strategy Logic and Operating Mechanism
The 100-day moving average is used to avoid periods of sustained decline, and the recent 20-day momentum is used to confirm that the uptrend is still ongoing. Once both conditions are met, the allocation amount is determined by volatility. For example, if BTC's volatility is 70% and the target is set at 35%, the allocation would be about 50% of account equity. If US500's volatility is 10%, the calculation would yield 1.5 times, but the rule caps it at 1.25 times. This prevents over-allocation during low-volatility periods.
Contract data is used only to reduce allocation amounts, not to determine the direction of gains or losses. When long accounts are clearly excessive while aggressive selling is strong, the planned allocation is reduced to 70%. When the funding rate exceeds 0.05% for three consecutive settlement periods, it is further reduced to 80% of the original. When both conditions occur simultaneously, at least half of the base allocation is retained to avoid fully exiting at the strongest point of a rally. When price falls below the 100-day moving average or the recent 20-day momentum turns negative, the base rules trigger a sell.
The overall portfolio target volatility cap is 15%. If several asset classes become increasingly correlated and the projected overall volatility exceeds the cap, all allocations are reduced proportionally. No single asset's risk contribution exceeds 40% of the portfolio. Buy and sell signals and allocation amounts are checked daily, and capital ratios across assets are adjusted monthly. This allows for timely exits while reducing unnecessary frequent trading.
2.5 Practical Application Example
Taking a $1 million account as an example, assume BTC, ETH, US500, and NAS100 all meet buy conditions, with 20-day volatilities of 45%, 72%, 10%, and 18%, respectively. Per the rules, the initial allocation ratios for the four asset classes would be approximately 77.8%, 48.6%, 125%, and 83.3%. If BTC and ETH contract trading is overly crowded, crypto allocations are reduced by 30%, and the freed capital is temporarily held as cash rather than immediately rotated into stock indices.
If BTC falls below its 100-day moving average the following week, the BTC position exits on the next trading day; ETH continues to be held if it still meets conditions. If NAS100's 20-day momentum turns negative while still above the 100-day moving average, NAS100 also exits, as recent trend confirmation has been invalidated. The model allows for temporarily holding a higher cash proportion. Re-entry requires both conditions to be restored simultaneously.
2.6 Historical Backtest Results
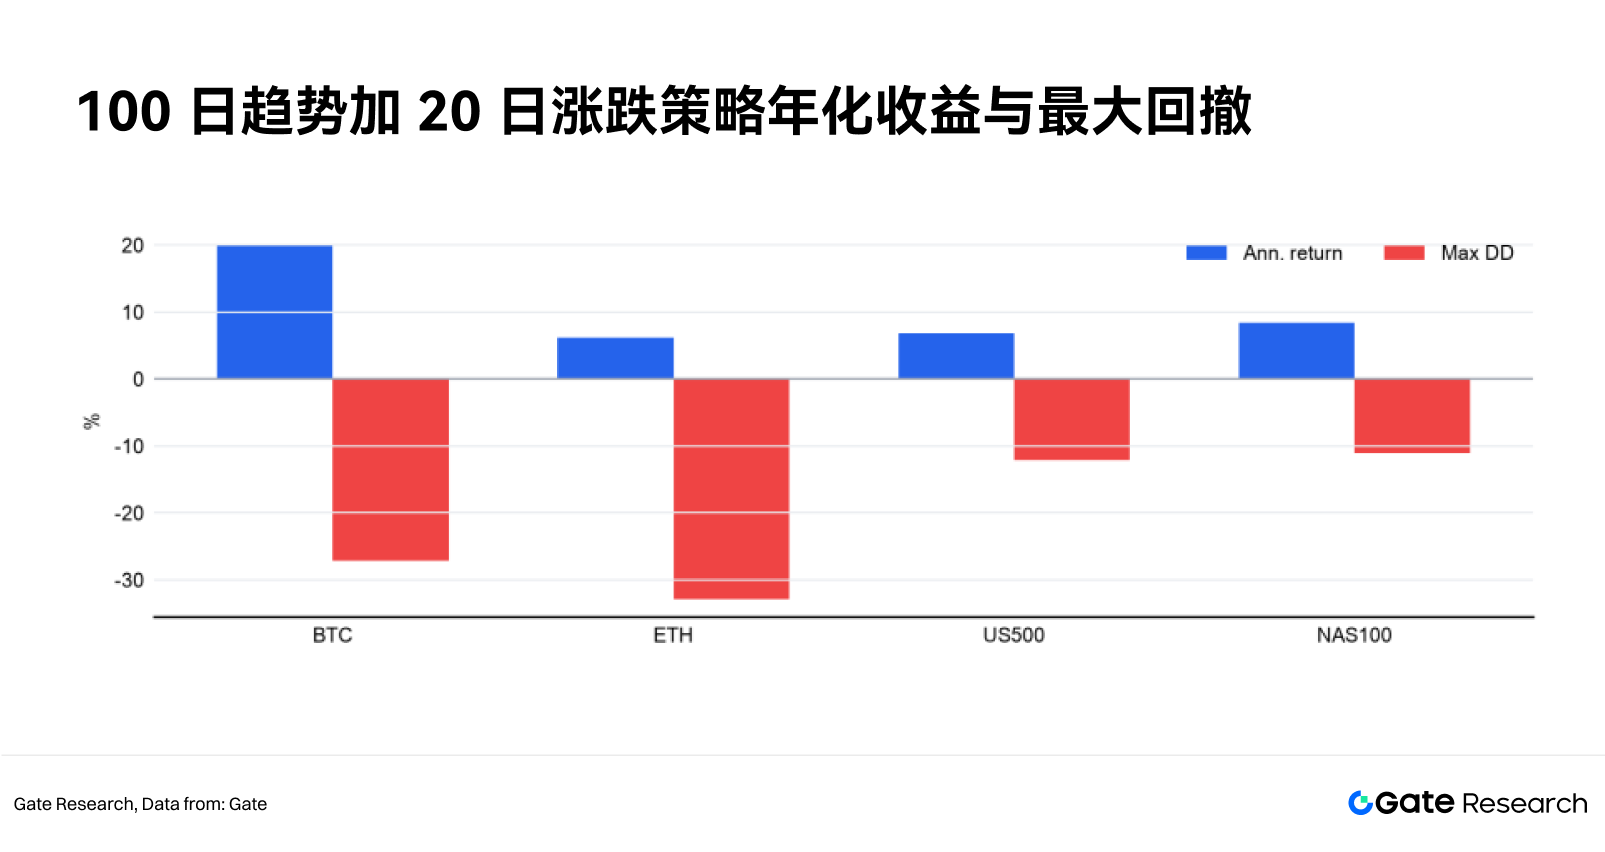
From early 2022 through the end of August 2026, the BTC strategy averaged 20.1% annual returns, with a maximum peak-to-trough decline of 27.2% and cumulative returns of 135.4%. The ETH strategy averaged 6.2% annual returns, with a maximum decline of 32.9% and cumulative returns of 32.6%. The US500 strategy averaged 6.8% annual returns, with a maximum decline of 12.1%; the NAS100 strategy averaged 8.4% annual returns, with a maximum decline of 11.0%. BTC had the highest returns, ETH's results were weaker, and the two US indices had lower returns but better drawdown control.
From January to August 2026, all four assets achieved positive returns: BTC at 12.1%, ETH at 10.