
U.S. and Iran Brew New Round of Talks, Bitcoin Recovers Losses Alongside U.S. Stocks
- Core View: Against the backdrop of easing signs in U.S.-Iran geopolitical tensions, risk appetite in the cryptocurrency market has rebounded. Bitcoin's price has staged a strong rally, showing short-term bullish sentiment. However, whether the subsequent trend can reverse depends on the liquidation of short positions in key resistance zones and the progress of external catalysts such as geopolitics.
- Key Elements:
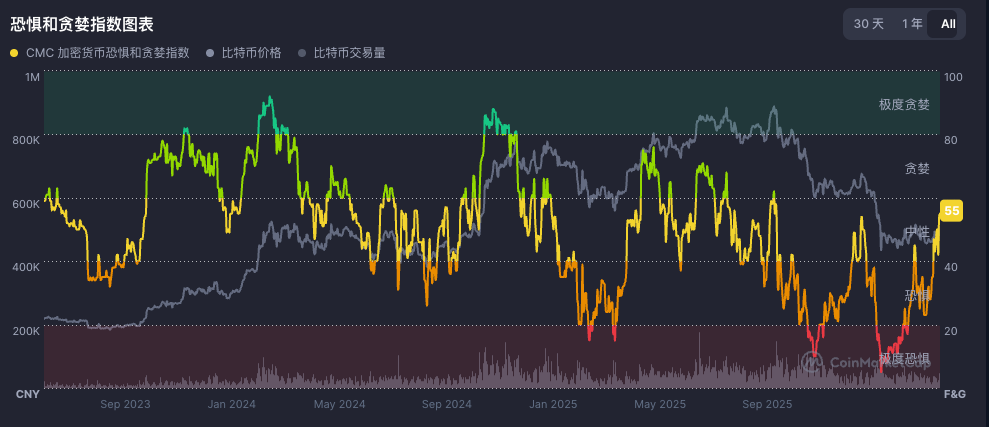
- Market Sentiment and Price Rebound: The Crypto Fear & Greed Index has recovered from an "Extreme Fear" level of 12 to 21. Bitcoin's price has risen from around $70,500 to over $74,000, and the total crypto market cap has recovered to approximately $2.52 trillion.
- Geopolitics Driving the Market: The U.S.-Iran Strait of Hormuz blockade order initially pushed oil prices higher, but subsequent rising expectations for peace talks led to a pullback in oil prices, alleviating inflation and interest rate pressures, creating conditions for a rebound in risk assets.
- Bitcoin Spot Market Bullish Signal: The spot Cumulative Volume Delta (CVD) surged significantly to $63.9 million, indicating aggressive buying activity in the spot market and strong short-term bullish sentiment.
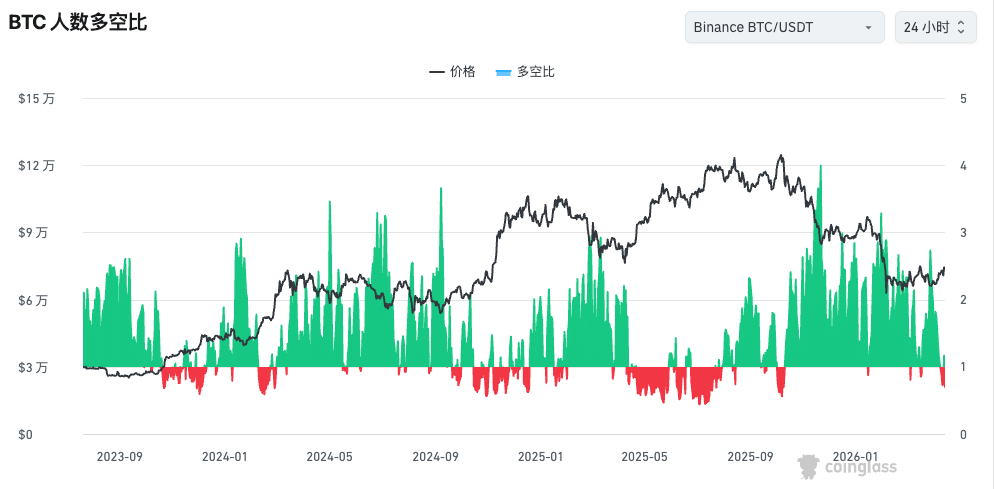
- Key Resistance and Positioning Structure: BTC has accumulated a large number of short positions (approximately $6 billion) in the $72,200 to $73,500 range. The Binance retail long/short ratio is as low as 0.7, indicating extreme bearish market sentiment, which sets the stage for a potential short squeeze.
- Subsequent Core Catalysts: The short-term trend hinges on the outcome of the potential second round of U.S.-Iran talks on April 16. A longer-term ceasefire agreement would further benefit risk assets. Secondly, attention should be paid to the impact of March PPI data on interest rate cut expectations.
Original Author: ChandlerZ, Foresight News
On April 14th, BTC surged from around $70,500, reclaiming the $74,000 level. ETH rose 7.63% to approximately $2,367. The total crypto market cap recovered to about $2.52 trillion, with Bitcoin's dominance holding steady between 57% and 58%.
According to data from Alternative.me, today's Crypto Fear & Greed Index rose to 21 (yesterday's reading was 12, indicating "Extreme Fear"), suggesting the market remains in an "Extreme Fear" state. It hit a low of 8 in early April, a rare reading since 2022.
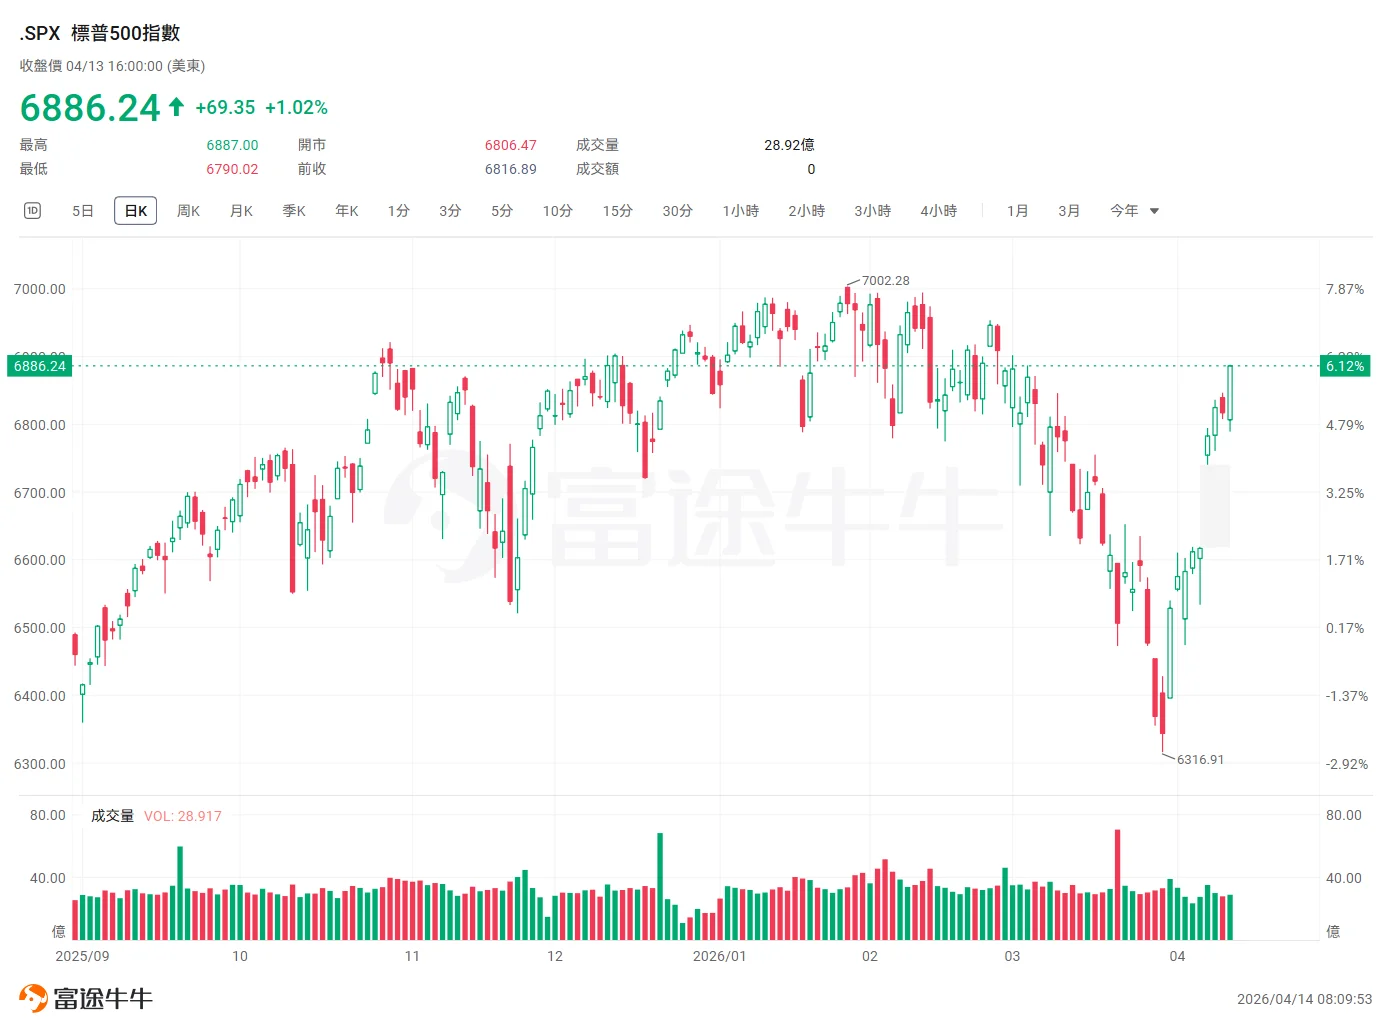
In traditional financial markets, the S&P 500 rose 1.02% to 6,886 points, recovering all losses incurred since the US and Israel provoked the Iran conflict and surpassing its February 27th closing level of 6,878 points. The Nasdaq gained 1.23%, marking its ninth consecutive day of gains and its longest winning streak since September 2025. The Philadelphia Semiconductor Index closed at a record high for the fourth straight day, historically breaking through the 9,000-point mark for the first time.
Oil prices experienced significant intraday volatility. Abu Dhabi Murban crude once touched $106.49 per barrel. However, as expectations for peace talks heated up, WTI crude pulled back to $99.08 by the close, and Brent settled at $99.36, both failing to hold above the $100 threshold. Gold fell slightly by 0.21% to $4,739. The US Dollar Index dropped 0.24% to a new low in over a month, while the offshore Chinese yuan (CNH) rose for the seventh consecutive day, breaking through 6.82 intraday to reach a three-year high.
US and Iran Remain in Contact, Markets Bet on De-escalation
During Asian trading hours, the Islamabad talks, which lasted over 20 hours from April 11th to 12th, ended without a deal. Vance returned empty-handed, with disagreements centered on Iran's nuclear program and uranium enrichment red lines. Following the breakdown, Trump announced that US forces would immediately commence a blockade of the Strait of Hormuz, effective 20:00 on April 13th, targeting all vessels entering or leaving Iranian ports.
After the blockade order took effect, Trump stated on social media that any Iranian fast-attack craft approaching the blockade zone would be "immediately destroyed." Oil prices, US Treasury yields, and the US dollar all jumped at the start of the Asia-Pacific session.
Later during the Asian night session, Trump told media at the White House, "This morning, the right people, the appropriate people called us, they want to make a deal." He did not specify who participated in the call. Almost simultaneously, Bloomberg, citing informed sources, reported that the US and Iran are discussing holding a second round of face-to-face talks, aiming to reach a longer-term ceasefire agreement before the expiration of the two-week truce announced on April 7th.
According to RIA Novosti, citing a report from The Atlantic, the next round of talks may be held in Islamabad on April 16th. Pakistani Prime Minister Shehbaz Sharif stated that all parties are working to resolve outstanding issues between the US and Iran, with officials from Turkey and Egypt also participating in mediation.
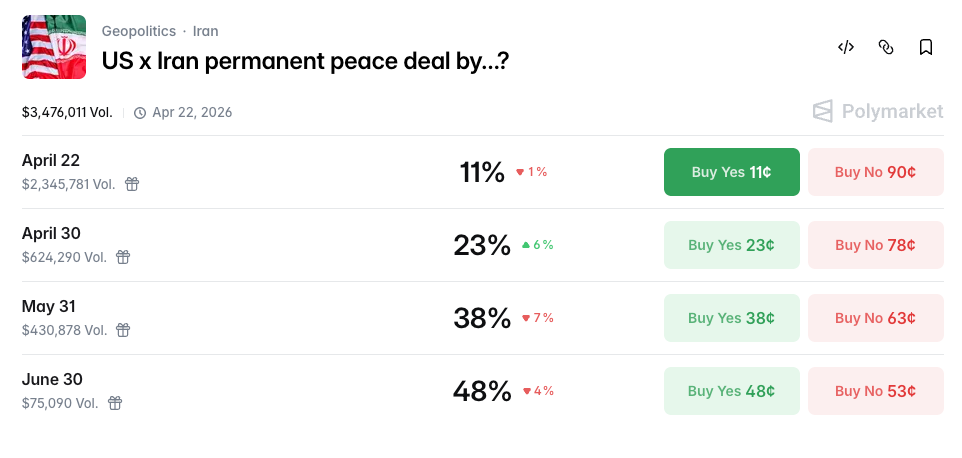
Latest data from Polymarket shows the probability of the US and Iran reaching a permanent peace agreement by April 30th this year increased by 6% to 23%, while the probability of a deal by May 31st decreased to 38%.
Influenced by this, oil prices traced a classic inverted V-shape. The blockade news pushed Murban crude to $106.49 during the Asia-Pacific session, but expectations for talks capped the gains. WTI pulled back to $99.08 by the close, falling back below $100. The retreat in oil prices from their highs marked the starting point for the day's risk appetite recovery. As oil prices fell, inflation expectations eased, interest rate pressure temporarily subsided, creating room for a rebound in risk assets.
The US dollar also opened higher but turned lower. The ICE US Dollar Index fell 0.24% by the close, and the Bloomberg Dollar Index dropped to its lowest level since March 3rd. A weaker dollar provides a short-term tailwind for BTC.
Strong Short-Term Bullish Sentiment in Bitcoin Spot Market
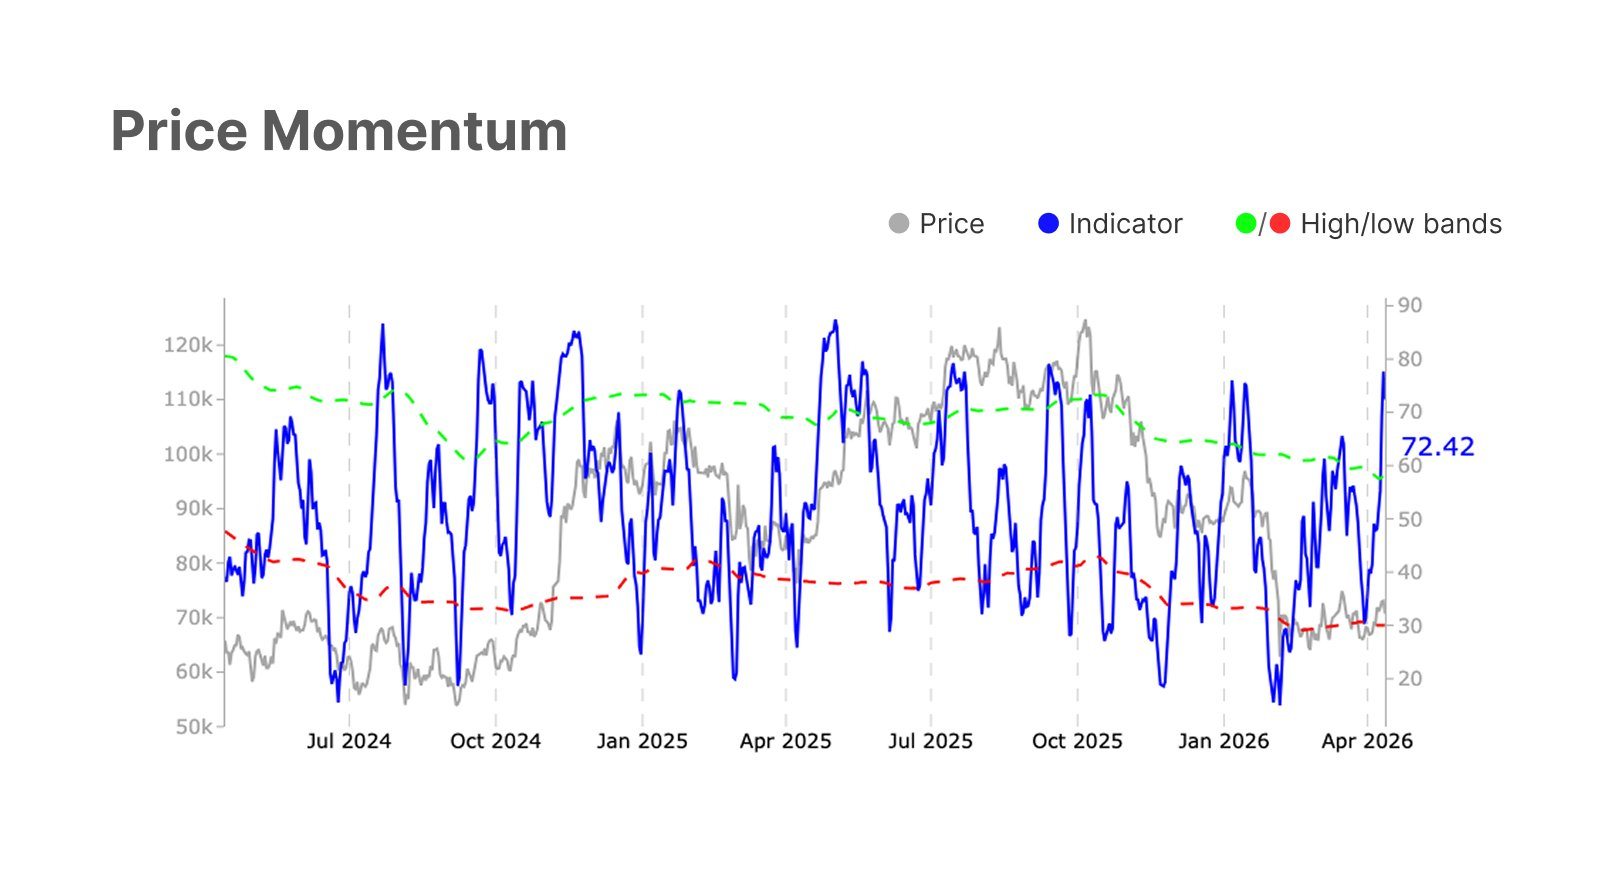
The Bitcoin market is exhibiting significant upward momentum. The price momentum indicator rose from 47.7 to 72.4, with the current value exceeding the high-frequency band of 58.4 and surpassing previous highs, indicating the market is experiencing robust upward momentum. The spot market also reflects this bullish sentiment. The spot Cumulative Volume Delta (CVD) surged sharply from $34.4 million to $63.9 million, exceeding the high-frequency band of $33.4 million. This indicates aggressive buying behavior in the spot market, with strong short-term bullish sentiment and increasing buy-side pressure.
Spot trading volume increased from $5.3 billion to $6.3 billion, indicating rising trading activity. However, it remains below the lower bound of the high-frequency band at $6.8 billion, suggesting participation has recovered but not yet reached peak levels. The rally has some capital support but is not yet fully fueled.
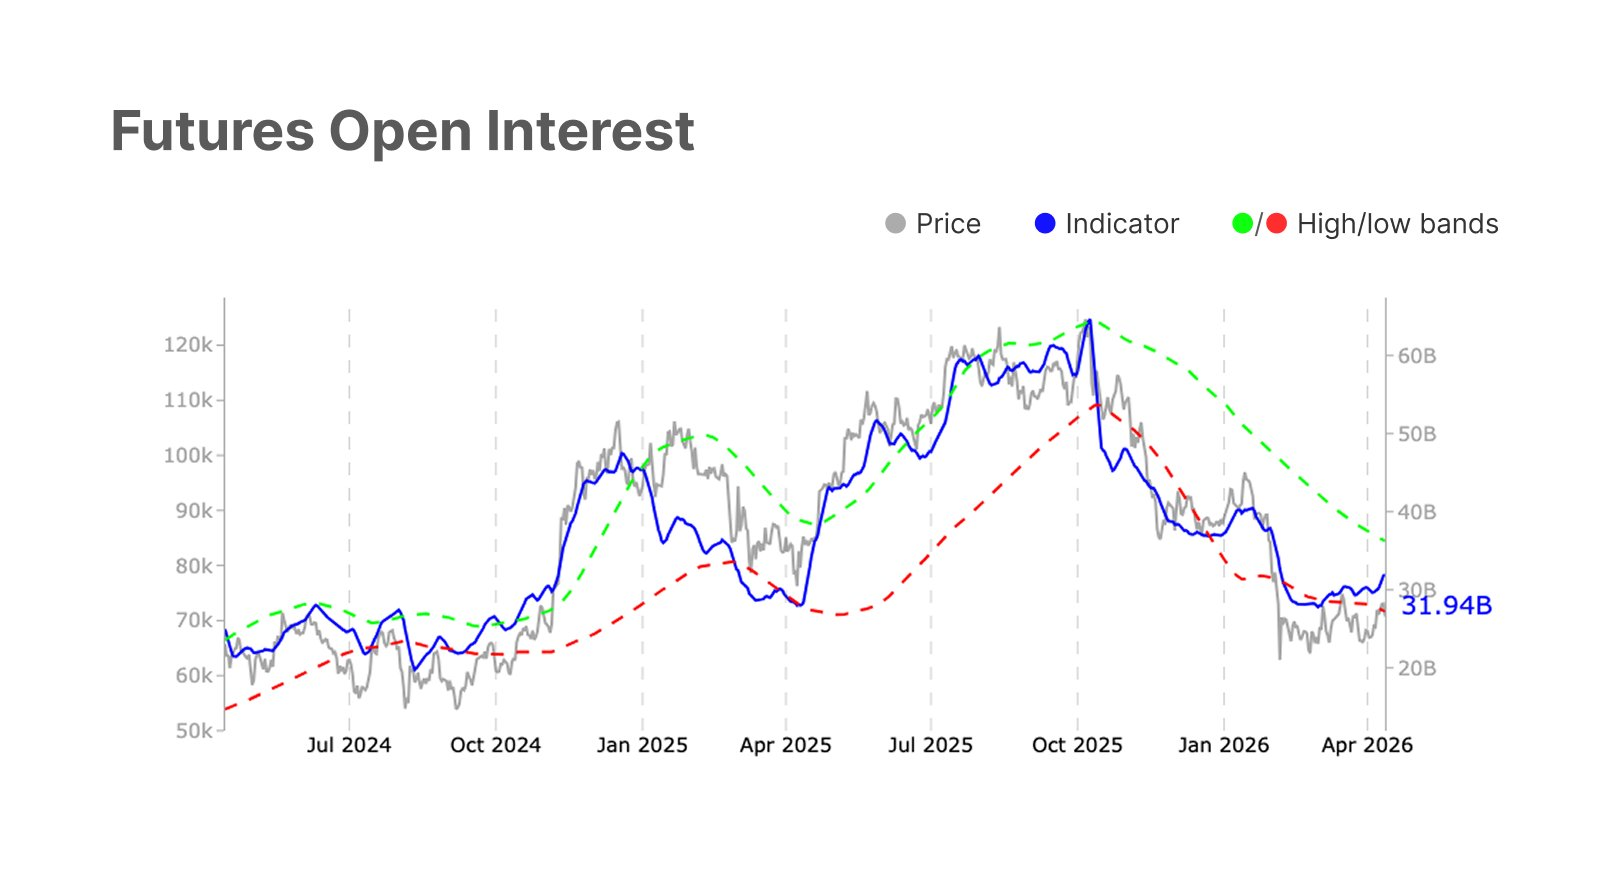
Meanwhile, the futures market also shows higher speculative interest and leverage levels, with open interest growing by 7.2%. However, the market also reveals signs of caution, with short positions increasing and long funding payments decreasing by 198.6%.
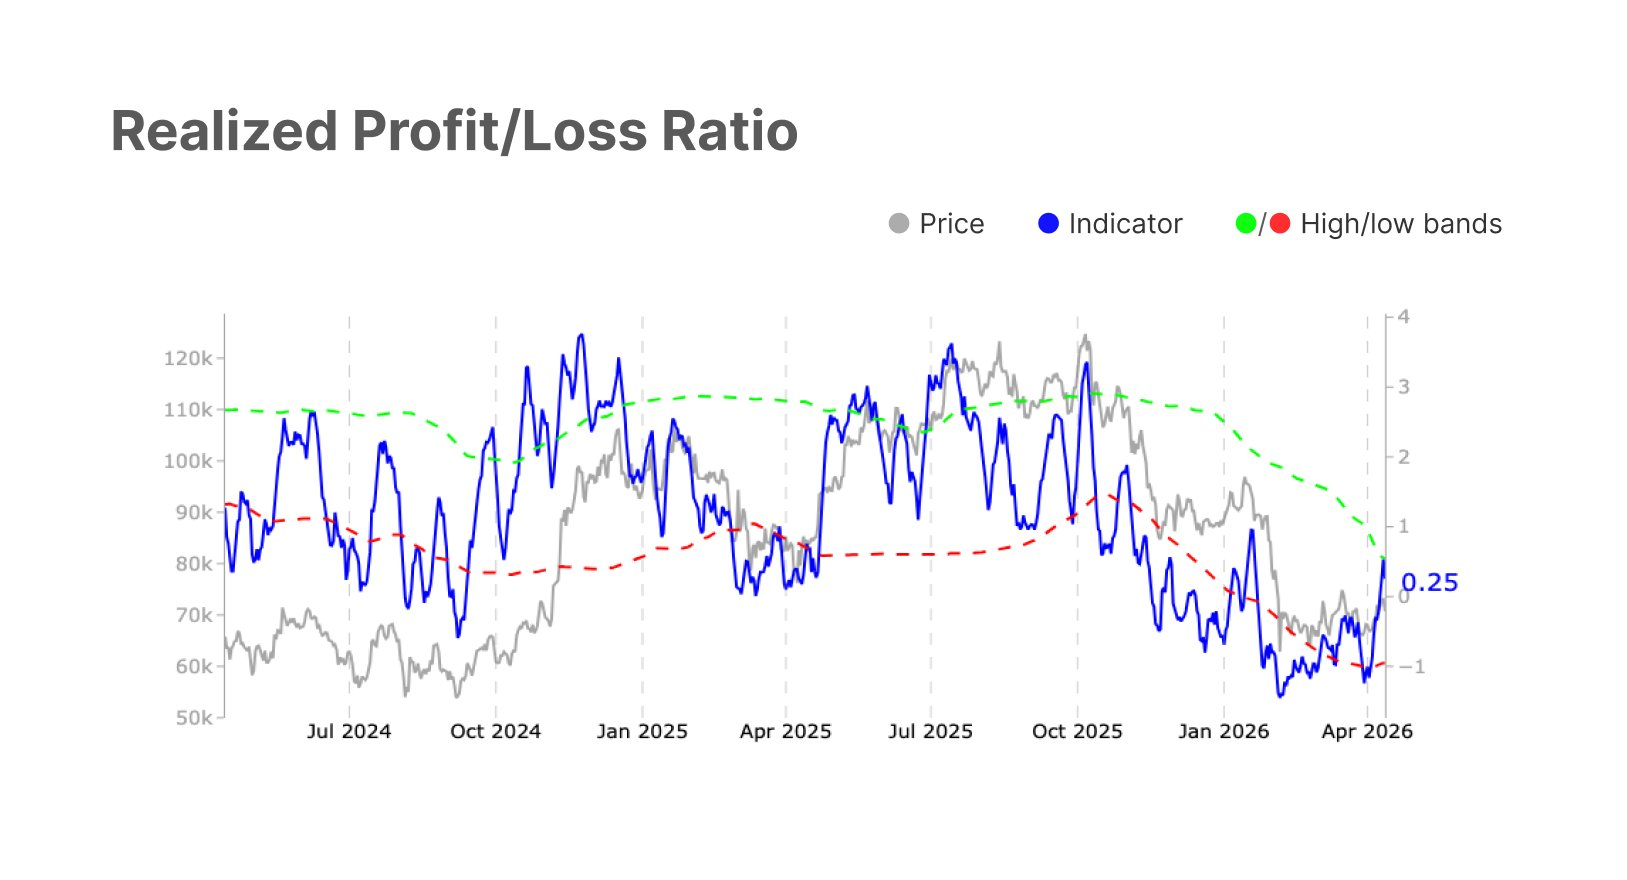
From a profitability perspective, market pressure has eased somewhat, with unrealized losses decreasing and the proportion of circulating Bitcoin in profit rising. The shift from loss to profit indicates a positive shift in investor sentiment. Overall, various indicators collectively suggest the market exhibits strong bullish sentiment, increased investor participation, and enhanced risk appetite, although there are also signs of caution and market stabilization.
Outlook for the Crypto Market
The core question facing BTC after reclaiming $74,000 remains: is this a reversal or a rebound?
Looking at the positioning structure, a significant accumulation of short positions currently lies in the $72,200 to $73,500 range. Finance Magnates, citing analyst views, states that for BTC to challenge $80,000 in the short term, two conditions are needed: first, the liquidation of shorts in this range triggering a cascade effect (involving approximately $6 billion in short positions), and second, sustained ETF inflows coupled with the maintenance of the ceasefire.
Simultaneously, Coinglass data shows the Binance retail BTC long/short ratio is 0.7, an indicator signaling extreme bearishness. Historically, whenever the long/short ratio falls to around 1 or below, BTC price is often near a阶段性 (stage) bottom, followed by a rapid rebound. Similar patterns occurred in early 2024, September 2024, and early 2025, where highly crowded short positions were liquidated by rising prices, forming a short squeeze, with the green bars (representing long liquidations?) subsequently expanding sharply.
The current positioning structure shares similarities with these historical nodes. BTC has been seesawing within the $68,000 to $73,000 range, with short positions continuously accumulating under the刺激 (stimulus) of negative news like the blockade order and failed talks, pushing the long/short ratio to low levels. Once a clear catalyst emerges, such as a ceasefire extension from a second round of talks, an upward price breakout would force the dense short positions to cover, creating a cascade of liquidations and amplifying the rally. The current positioning structure provides fuel for a potential short squeeze.
Ranking short-term catalysts, the potential second round of US-Iran talks possibly on April 16th is at the top. If the ceasefire is extended or a longer-term agreement framework is reached, a further decline in oil prices would ease inflation expectations, indirectly opening space for Fed rate cuts. Next is the March PPI data released on April 14th; if it comes in below expectations, it would strengthen the rate cut narrative.


