CoinW Research Weekly Report (Issue: 2026.1.19 - 2026.1.25)
- Core View: This week, the overall cryptocurrency market showed a trend of widespread decline in market capitalization and DeFi Total Value Locked (TVL), while on-chain transaction activity saw a recovery. Market sentiment leaned towards extreme fear.
- Key Elements:
- The total market cap fell 5.27% to $3.05 trillion. The Fear & Greed Index stood at 19 (Extreme Fear). Both Bitcoin and Ethereum spot ETFs recorded net outflows this week.
- The total DeFi TVL dropped 9.98% to $117.2 billion. TVL across all major public chains declined, with the Sui network experiencing the largest drop (-19.14%).
- Daily DEX trading volume on-chain mostly recovered, with the Sui network seeing a weekly increase of 72.86%. Daily active addresses generally grew, with Sui up 48.36%.
- The total stablecoin market cap slightly decreased by 1.02%. However, the combined issuance of USDT and USDC increased by $2.34 billion this week, a significant rise of 314.16% compared to last week.
- In industry developments, BitGo successfully completed its IPO on the NYSE, Superstate secured $82.5 million in Series B funding, and several new projects (such as HyperLend, Lazbubu) announced token launch plans.
CoinW Research Institute
Key Takeaways
The total global cryptocurrency market capitalization is $3.05 trillion, down 5.27% this week from $3.22 trillion last week. As of press time, the cumulative net inflow into U.S. Bitcoin spot ETFs is approximately $56.49 billion, with a net outflow of $1.33 billion this week; the cumulative net inflow into U.S. Ethereum spot ETFs is approximately $12.30 billion, with a net outflow of $611 million this week.
The total stablecoin market capitalization is $310.8 billion, down 1.02% from $314.0 billion last week. Among them, USDT has a market cap of $186.7 billion, accounting for 60.07% of the total stablecoin market cap, down approximately 0.11% from $186.9 billion last week; followed by USDC with a market cap of $72.4 billion, accounting for 23.29% of the total stablecoin market cap, down approximately 4.74% from $76.0 billion last week; DAI has a market cap of $5.36 billion, accounting for 1.72% of the total stablecoin market cap, remaining flat compared to last week.
According to data from DeFiLlama, the total DeFi TVL this week is $117.2 billion, down approximately 9.98% from $130.2 billion last week. Categorized by public chain, the three chains with the highest TVL are Ethereum, accounting for 57.81%; the Solana chain, accounting for 6.75%; and Bitcoin, accounting for 5.71%.
Looking at on-chain core data this week, transaction activity has generally recovered, but TVL has declined across the board. In terms of daily on-chain DEX trading volume, only BNB Chain ($1.59B, -17.62%) and Aptos ($69.74M, -4.31%) saw declines this week, while other major public chains experienced rebounds. Sui rebounded from $70 million last week to $121 million, a weekly increase of 72.86%; Solana ($3.152B, +6.49%) and Ethereum ($1.127B, +28.07%) saw modest recoveries, while Ton remained at a low level of $6.8 million. Regarding transaction fees, both BNB Chain and Ton remained at $0.01; Ethereum ($0.01, -50%) and Aptos ($0.000002, -11.97%) decreased, while Solana ($0.002, +100%) and Sui ($0.003, +28.16%) increased. In terms of daily active addresses, only BNB Chain (2.70M, -0.74%) saw a slight decline, while all other chains achieved growth. Sui rose from 448,000 to 664,000, a weekly increase of 48.36%, followed by Solana (2.71M, +21.52%) and Ton (123,000, +27.92%); Aptos (955,000, +14.32%) and Ethereum (668,000, +13.30%) saw relatively moderate increases. TVL declined across the board, including Ethereum ($67.35B, -10.91%), BNB Chain ($6.64B, -7.78%), Solana ($7.87B, -13.19%), Aptos ($420M, -13.33%), Ton ($79M, -12.3%), and Sui ($850M, -19.14%).
New Projects to Watch: HyperLend is a crypto asset lending platform built on Hyperliquid's EVM blockchain, aiming to make crypto asset lending more efficient, transparent, and secure. Lazbubu is a Web3-native AI companion smart agent built on BNB Chain, which anchors and records user-AI interactions (such as chatting, decision-making, adventure activities, etc.) on the blockchain through its proprietary DAT (Data Anchoring Token) mechanism, making this behavioral data verifiable and truly owned by users. Cork Protocol is a "programmable risk layer" infrastructure protocol for the decentralized finance (DeFi) market, dedicated to building standardized risk pricing, hedging, and trading tools for on-chain assets (such as yield-bearing stablecoins, vault tokens, liquid staking/restaking tokens, and real-world assets RWA).
Table of Contents
Key Takeaways
I. Market Overview
1. Total Cryptocurrency Market Cap / Bitcoin Dominance
2. Fear & Greed Index
3. ETF Inflow/Outflow Data
4. ETH/BTC and ETH/USD Exchange Rates
5. Decentralized Finance (DeFi)
6. On-Chain Data
7. Stablecoin Market Cap and Issuance
II. Hot Money Trends This Week
1. Top 5 Weekly Gainers Among VC Coins and Meme Coins
2. New Project Insights
III. Industry News
1. Major Industry Events This Week
2. Upcoming Major Events Next Week
3. Important Fundraising Last Week
IV. Reference Links
I. Market Overview
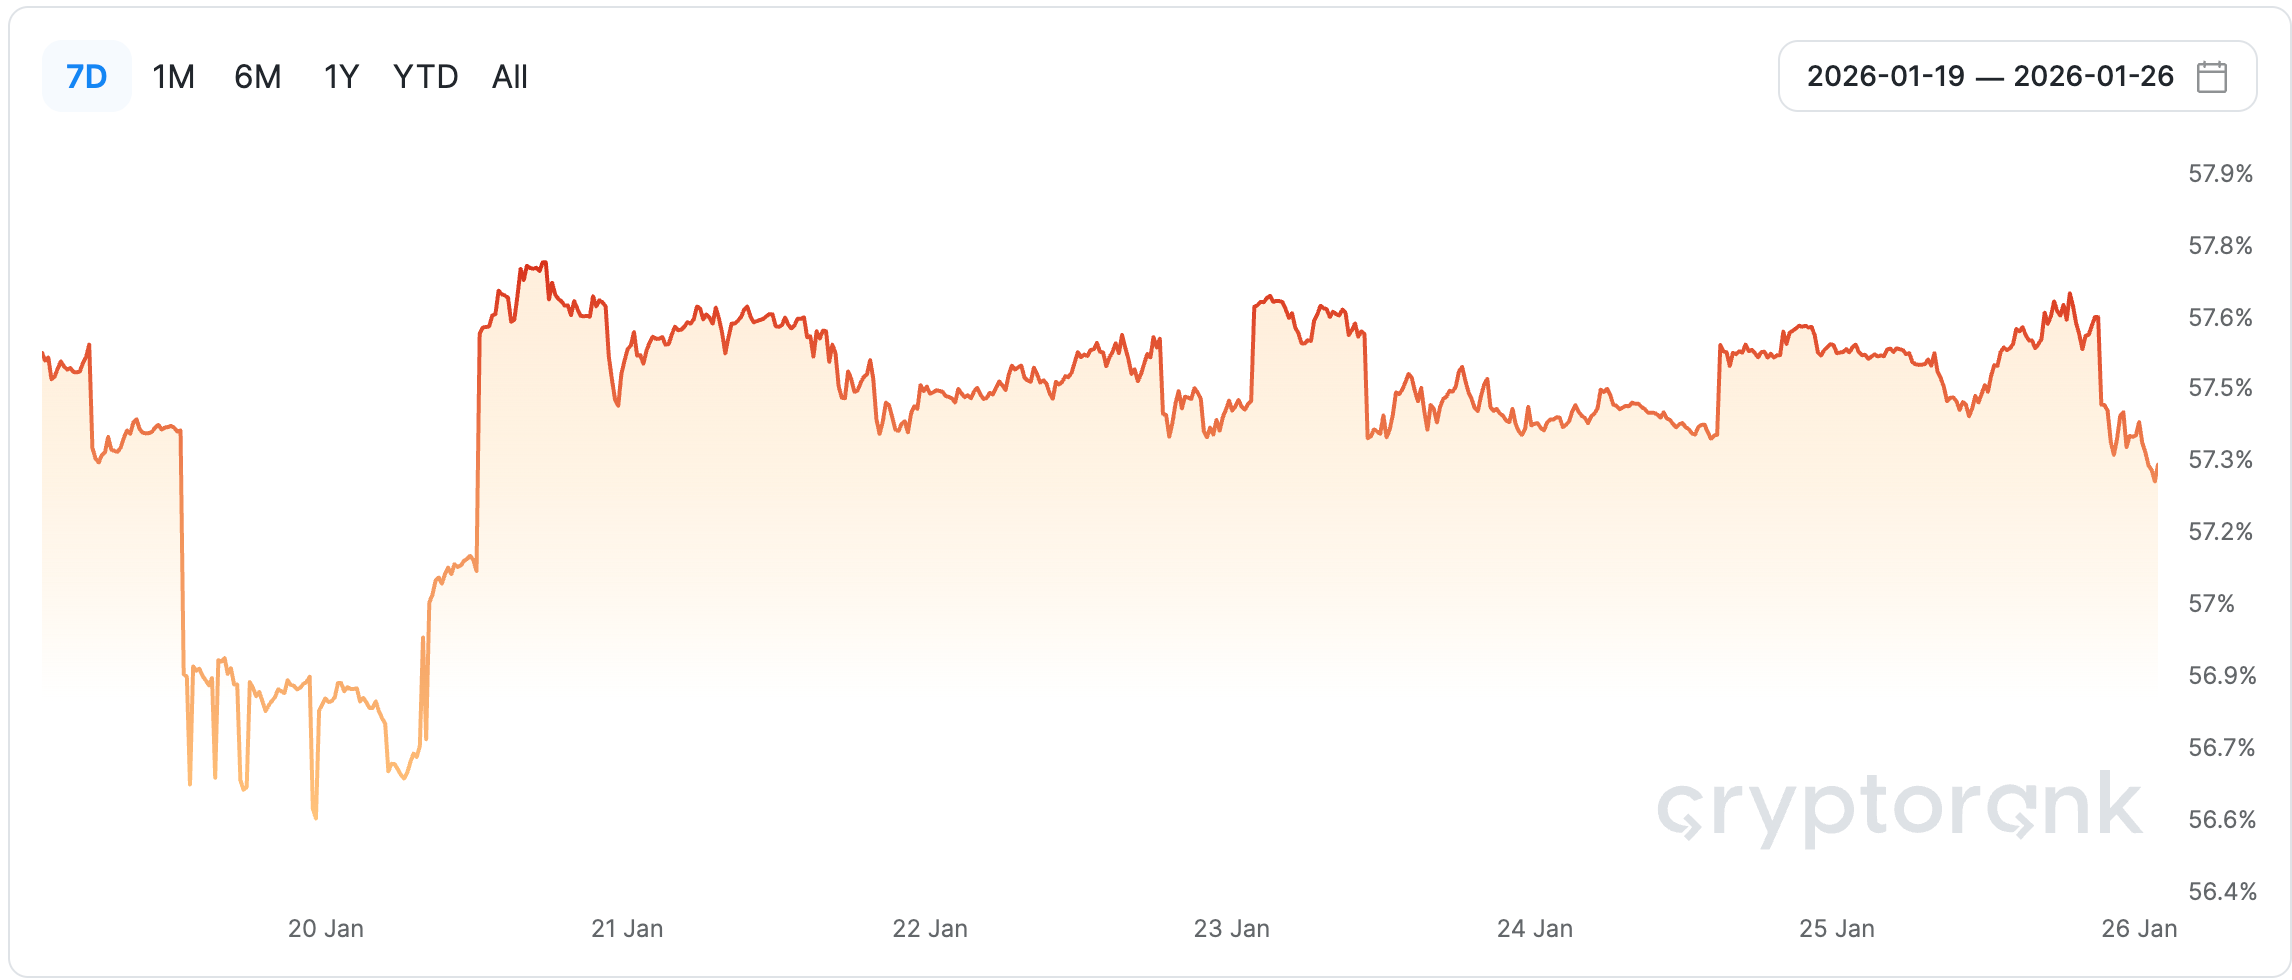
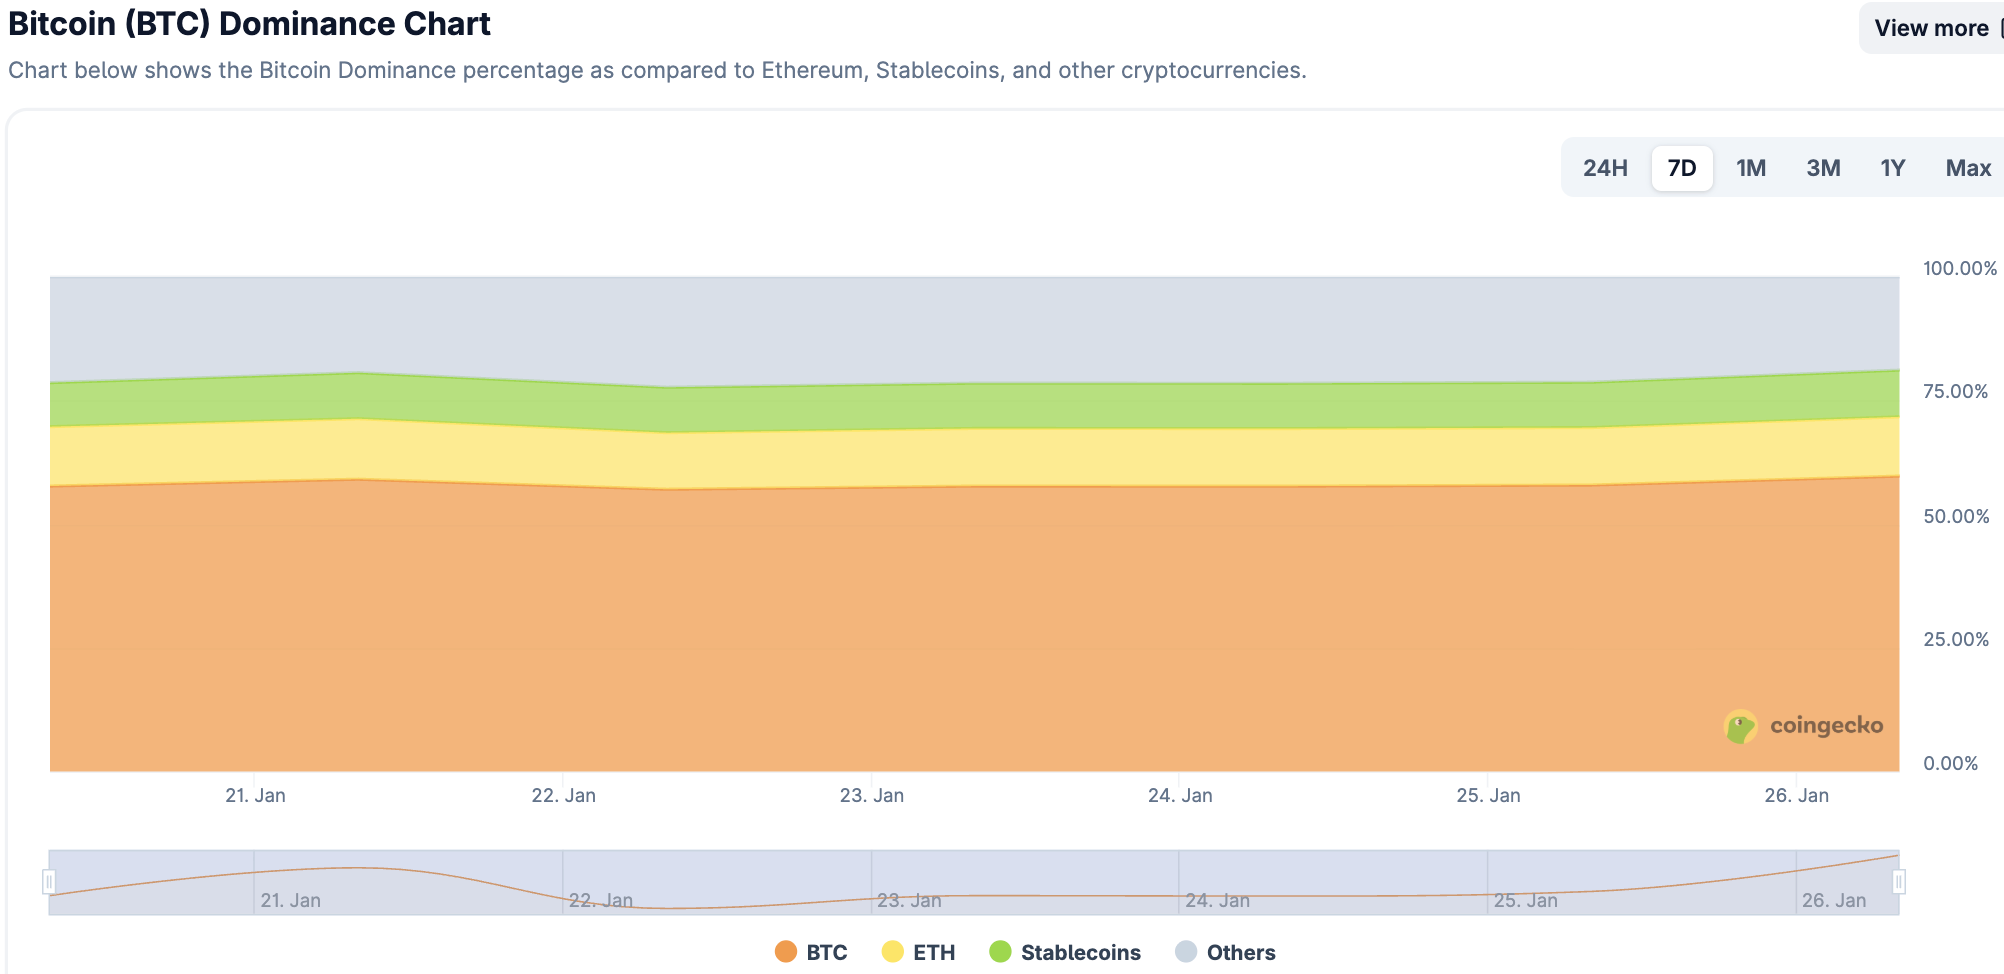
1. Total Cryptocurrency Market Cap / Bitcoin Dominance
The global total cryptocurrency market capitalization is $3.05 trillion, down 5.27% this week from $3.22 trillion last week.
Data Source: Bitcoin dominance from cryptorank, https://cryptorank.io/charts/btc-dominance
Data as of January 25, 2026
As of press time, Bitcoin's market capitalization is $1.74 trillion, accounting for 57.05% of the total cryptocurrency market cap. Meanwhile, the stablecoin market capitalization is $310.8 billion, accounting for 10.19% of the total cryptocurrency market cap.
Data Source: coingecko, https://www.coingecko.com/en/charts
Data as of January 25, 2026
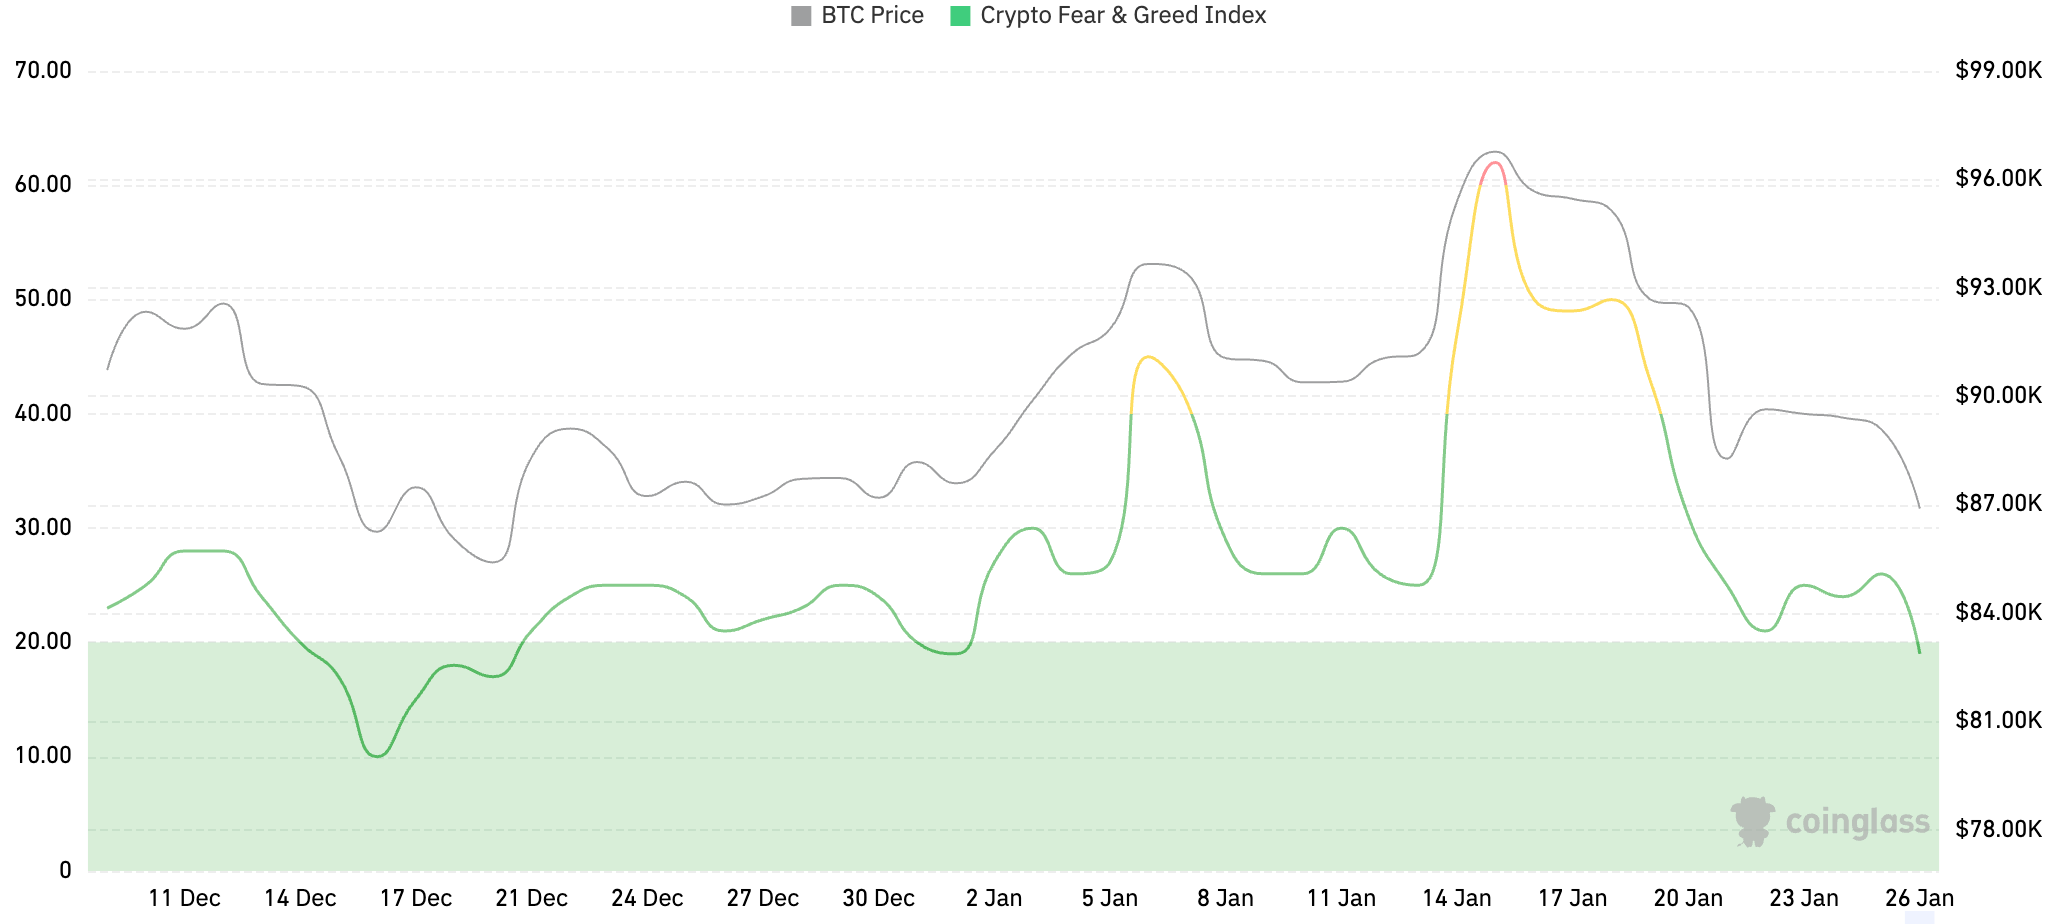
2. Fear & Greed Index
The Crypto Fear & Greed Index is 19, indicating Extreme Fear.
Data Source: coinglass, https://www.coinglass.com/pro/i/FearGreedIndex
Data as of January 25, 2026
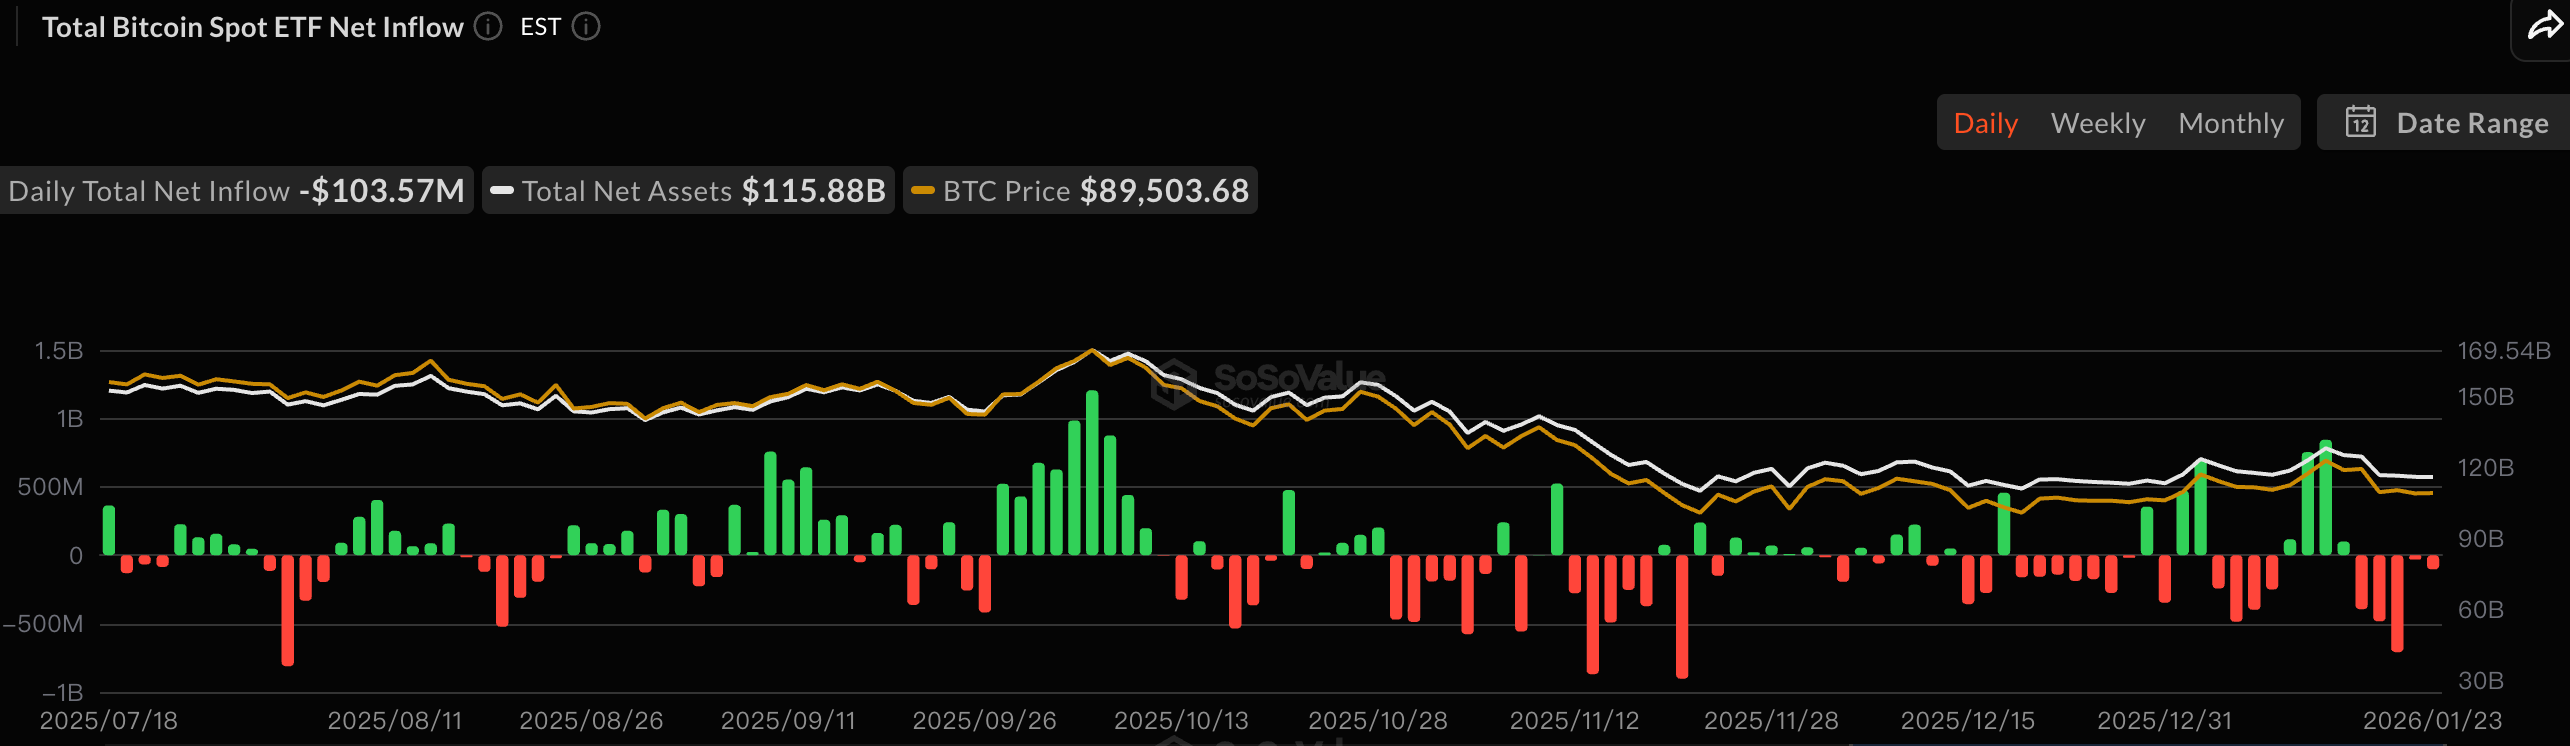
3. ETF Inflow/Outflow Data
As of press time, the cumulative net inflow into U.S. Bitcoin spot ETFs is approximately $56.49 billion, with a net outflow of $1.33 billion this week; the cumulative net inflow into U.S. Ethereum spot ETFs is approximately $12.30 billion, with a net outflow of $611 million this week.
Data Source: sosovalue, https://sosovalue.com/zh/assets/etf
Data as of January 25, 2026
4. ETH/BTC and ETH/USD Exchange Rates
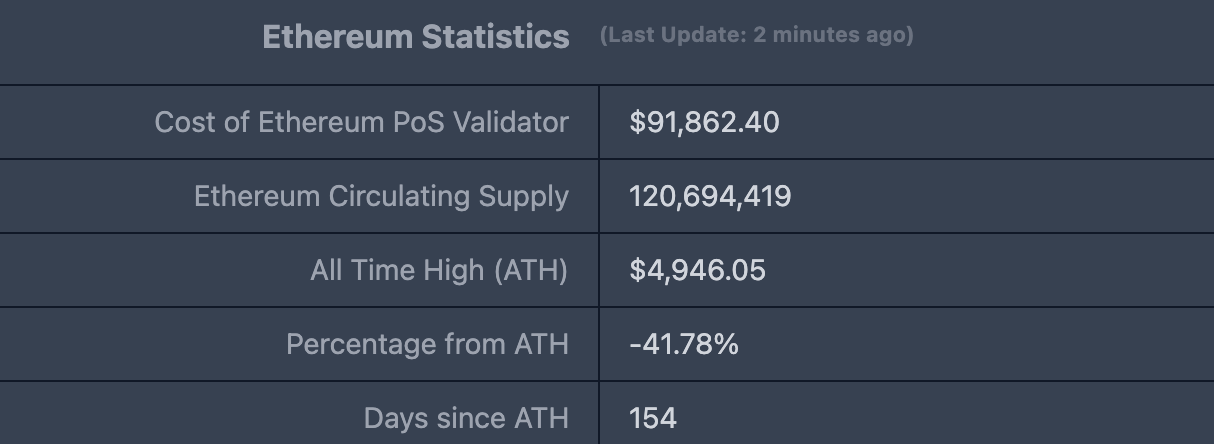
ETHUSD: Current price $2,875.99, all-time high $4,878.26, down approximately 41.78% from ATH.
ETHBTC: Currently 0.032840, all-time high 0.1238.
Data Source: ratiogang, https://ratiogang.com/
Data as of January 25, 2026
5. Decentralized Finance (DeFi)
According to data from DeFiLlama, the total DeFi TVL this week is $117.2 billion, down approximately 9.98% from $130.2 billion last week.
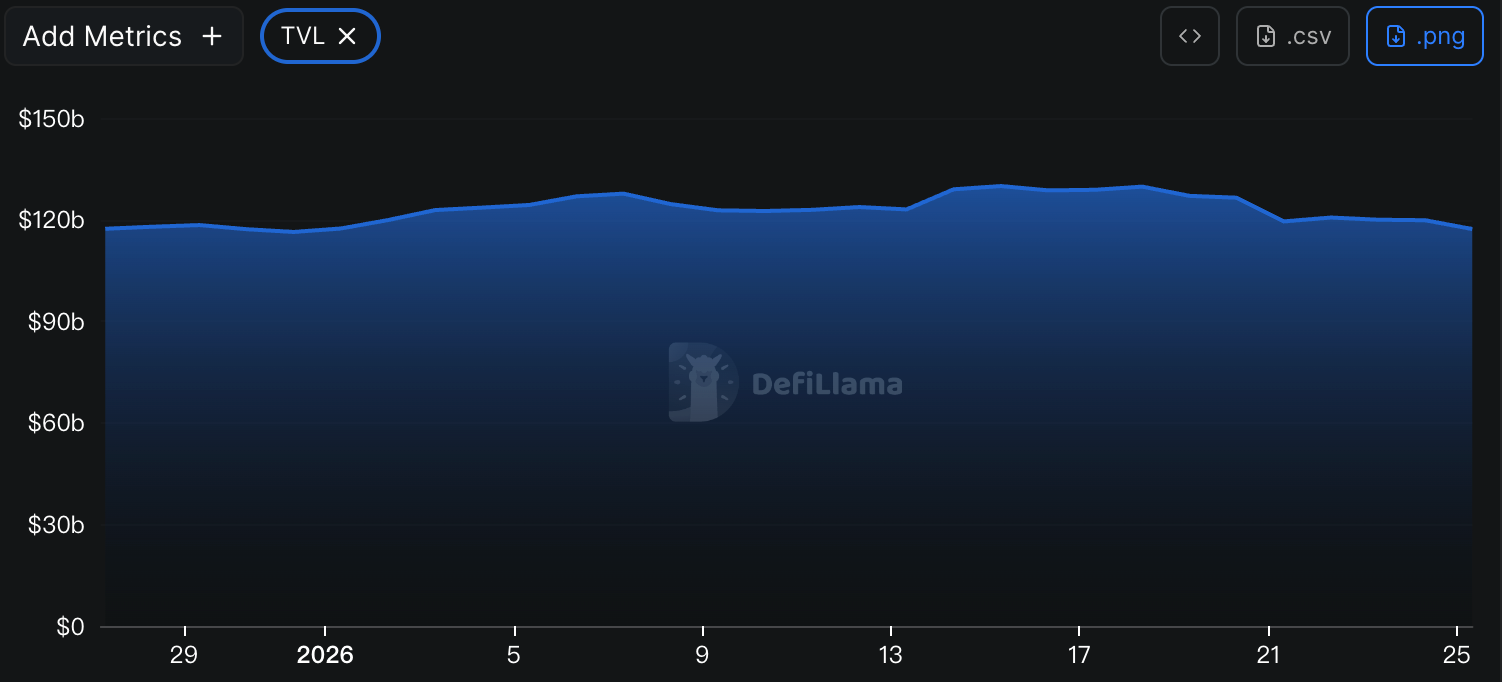
Data Source: defillama, https://defillama.com
Data as of January 25, 2026
Categorized by public chain, the three chains with the highest TVL are the Ethereum chain, accounting for 57.81%; the Solana chain, accounting for 6.75%; and Bitcoin, accounting for 5.71%.
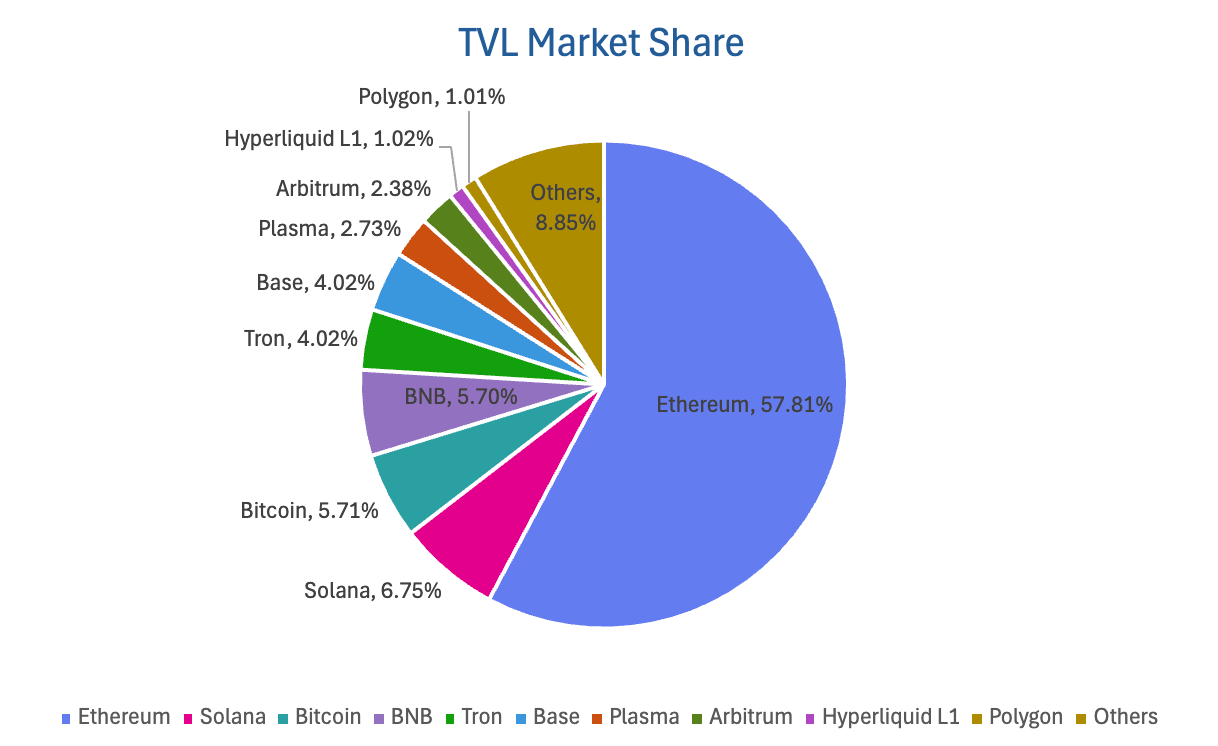
Data Source: CoinW Research Institute, defillama, https://defillama.com
Data as of January 25, 2026
6. On-Chain Data
Layer 1 Related Data
Analyzing current data for major Layer 1s including ETH, SOL, BNB, TON, SUI, and APTOS, focusing on daily trading volume, daily active addresses, and transaction fees.
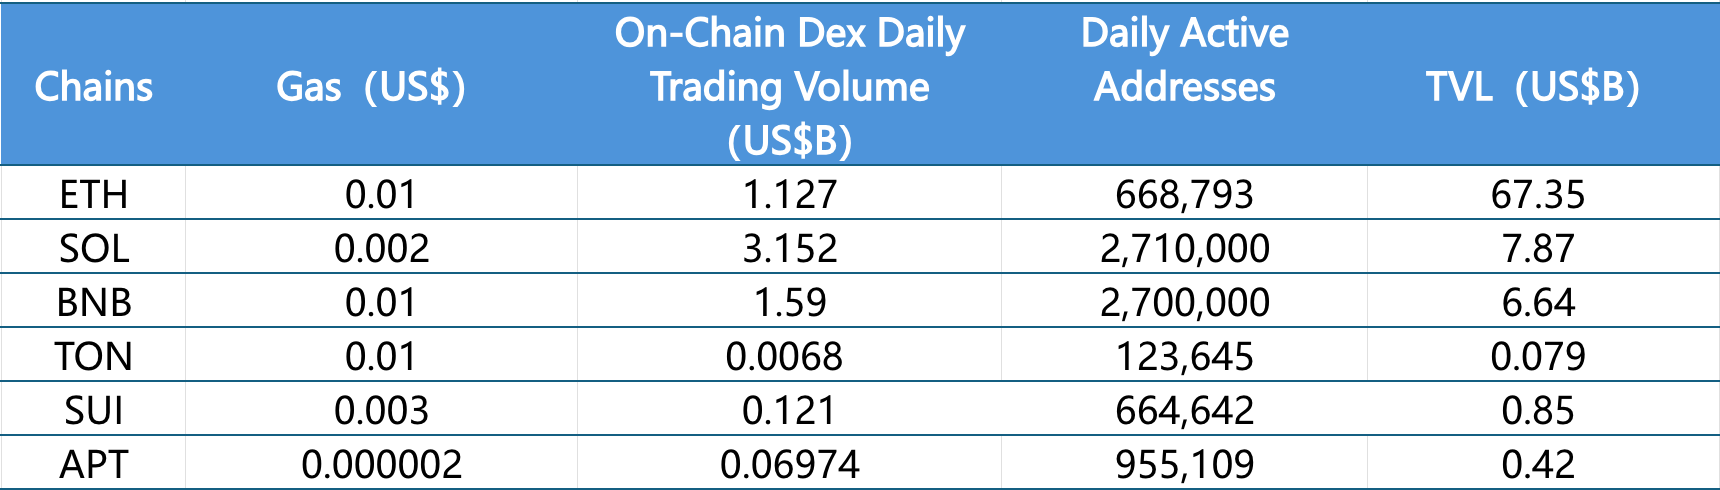
Data Source: CoinW Research Institute, defillama, https://defillama.com
Data as of January 25, 2026
On-Chain DEX Daily Volume & Transaction Fees: On-chain DEX daily volume and transaction fees are core metrics for measuring public chain activity and user experience. Regarding on-chain DEX daily volume, only BNB Chain ($1.59B) and Aptos ($69.74M) declined this week by 17.62% and 4.31% respectively; all other chains saw increases. The Sui chain rebounded from $70 million to $121 million, an increase of 72.86%; Ethereum ($1.127B) and Solana ($3.152B) saw modest rebounds of 28.07% and 6.49% respectively; Ton remained at a low level of $6.8 million. Regarding transaction fees, BNB Chain ($0.01) and Ton Chain ($0.01) remained flat compared to last week; Ethereum ($0.01) and Aptos ($0.000002) decreased by 50% and 11.97% respectively; Solana ($0.002) and Sui ($0.003) increased by 100% and 28.16% respectively.
Daily Active Addresses & TVL: Daily active addresses reflect a public chain's ecosystem participation and user stickiness, while TVL reflects user trust in the platform. In terms of daily active addresses, only BNB Chain (2.70M) saw a slight decline of 0.74% this week, while all other chains increased. The Sui chain rose from 448,000 last week to 664,000, an increase of 48.36%; followed by Ton (123,000) and Solana (2.71M), which grew by 27.92% and 21.52% respectively; Aptos (955,000) and Ethereum (668,000) saw relatively smaller increases of 14.32% and 13.30% respectively. TVL declined overall this week: BNB Chain ($6.64B, -7.78%), Ethereum ($67.35B, -10.91%), Ton ($79M, -12.3%), Solana ($7.87B, -13.19%), Aptos ($420M, -13.33%), and Sui ($850M, -19.14%).
Layer 2 Related Data
According to L2Beat data, the total TVL of Ethereum Layer 2 is $36.64 billion, with an overall decline of 6.91% this week compared to last week ($39.36B).